Assignment:
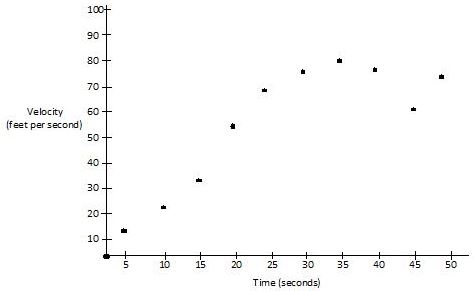
The graph of the velocity v(t), in ft/sec, of a car traveling on a straight road, for 0 is greater than or equal to t is greater than or equal to 50. A table of values for v(t), at 5 second intervals of time t.


a.) During what intervals of time is the acceleration of the car positive? Give a reason for your answer.
b.) Find the average acceleration of the car, in ft/sec^2, over the interval 0 is greater than or equal to t is greater than or equal to 50
c.) Find one approximation for the acceleration of the car, in ft/sec^2, at t=40. Show the computations you used to arrive at your answer.
d.) Approximate anti-derivative v(t)dt of intervals 50 and 0 with Riemann sum, using the right endpoint of five subintervals of equal length. Using correct units, explain the meaning of this integral.
Provide complete and step by step solution for the question and show calculations and use formulas.