Discuss the below:
Q1. The number of homicides in Vermont from 1992 through 2001 is given in the following table. Find the mean, median, and mode of the data.
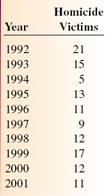
Q2. Find the standard deviation for the data shown in the table above.
a. What percent of the data is within 1 standard deviation of the mean?
b. What percent of the data is within 3 standard deviations of the mean?
Q3. The average resident of a certain East Coast suburb spends 42 minutes per day commuting, with a standard deviation of 12 minutes. Assume a normal distribution. Find the percent of all residents of this suburb who commute no more than 35 minutes per day.