Discuss the below:
Q1. The population mean and standard deviation are given below. Find the required probability and determine whether the given sample mean would be considered unusual.
A- Sample of n = 75, the probability of a sample mean being greater than 229 if u = 228 and o=4.4 is
B- The sample mean (would or would not) be considered unusual because it (does not lie, lies) within (1 standard deviation, 2 deviation, 3 deviation) of the mean of the sample means.
Q2. A drug tester claims that a drug cures a rare skin disease 73% of the time. The claim is checked by testing the drug on 100 patients. If at least 68 patients are cured, the claim will be accepted.
Find the probability that the claim will be rejected assuming that the manufactures claim is true. Use the normal distribution to approximate the binomial distribution when possible.
Q3. A vending machine dispenses coffee into an eight ounce cup. The amount of coffee dispensed into the cup is normally distributed with a standard deviation of 0.05 ounce. You can allow the cup to overfill 10% of the time. What amount should you set as the mean amount of coffee to be dispensed?
Q4. Find the indicated area under the standard normal curve. The area to the left of z=-1.27 under the standard normal curve is ____
Q5. Find the normal distribution find the probability of z occur in the indicated region. The probability is =____

Q6. Find the indicated z-scores shown. The z-scores are =____ (use a comma to separate answers as needed.

Q7. The average math SAT score is 516 with a standard deviation of 117. A particular high school claims that its students have unusually high math SAT scores. A random sample of 45 students from this school was selected, and the mean math SAT was 545. Is this high school justified in its claim? (Yes, no) because the z-score _____ is (unusual, not unusual) since it (does not lie, lies) within (1 standard deviation, 2 standard deviation, 3 standard deviation) of the mean of sample means.
Q8: A survey was conducted to measure the height of men. In the survey, respondents were grouped by age. In the 20.29 age group, the heights were normally distributed, with a mean of 69.2 inches and a standard deviation of 3.0 inches. A study participant is randomly selected. Complete parts (a) through (c).
(a) Fmd the probability that his height is less than 65 inches.
The probability that the study participant selected at random is less than 65 inches tall is
(b) Fmd the probability that his height is between 65 and 72 inches.
The probability that the study participant selected at random is between 65 and 72 inches tall i:
(c) Fmd the probability that his height is more than 72 inches.
The probability that the study participant selected at random is more than 72 inches tall is
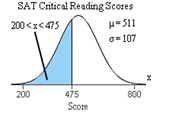
Q9: Assume a member is selected at random from the population represented by the graph. Find the probability that the member selected at random is from the shaded area of the graph Assume the variable axis normally distributed.
