Assignment:
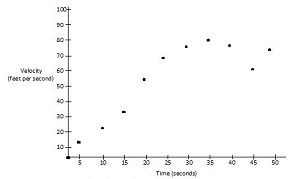
Q: The graph of the velocity v(t), in ft/sec, of a car traveling on a straight road, for 0 is greater than or equal to t is greater than or equal to 50, is shown . A table of values for v(t), at 5 second intervals of time t:
a.) During what intervals of time is the acceleration of the car positive? Give a reason for your answer.
b.) Find the average acceleration of the car, in ft/sec^2, over the interval 0 is greater than or equal to t is greater than or equal to 50
c.) Find one approximation for the acceleration of the car, in ft/sec^2, at t=40. Show the computations you used to arrive at your answer.
d.) Approximate anti-derivative v(t)dt of intervals 50 and 0 with Riemann sum, using the right endpoint of five subintervals of equal length. Using correct units, explain the meaning of this integral.

t v(t)
0 0
5 12
10 20
15 30
20 55
25 70
30 78
35 81
40 75
45 60
50 72