Complete the following:
Q1. A sample of the longest running shows on Broadway shows they had runs lasting the following number of years. Calculate the mean, median, mode, range, variance, and standard deviation in years.
9 4 4 13 7 6 3
Q2. Construct a frequency distribution and a frequency histogram of the following data:
Commuting Distance (One-Way) for Thirty-Two Workers (Miles)
|
13
|
7
|
10
|
3
|
15
|
40
|
11
|
8
|
|
4
|
62
|
15
|
31
|
17
|
26
|
8
|
19
|
|
10
|
3
|
21
|
1
|
16
|
28
|
24
|
17
|
|
12
|
6
|
19
|
28
|
35
|
11
|
16
|
21
|
Q3. Construct the 90%and 99% confidence interval for the population mean of the following data. Which is wider?
A computer manufacturer wants to estimate the mean number of hours per day all adults use computers at home. In a random sample of 21 adults, the mean length of time a computer was used at home was 1.7 hours. From past studies the company assumes sigma is 0.6 hour and that the population of times is normally distributed.
Q4. The proportion of middle managers leaving large IT companies within three years is to be estimated within 3 percent. The 0.95 degree of confidence is to be used. A study conducted several years ago revealed that the percent of managers leaving within three years was 21. To update this study, how many managers' files should be analyzed?
A. 511
B. 623
C. 709
D. 895
Q5. Tax Cuts or Entitlements? An economist believes that the distribution of opinions of US adults about whether tax cuts or entitlements is more important is different than the following:
|
Favor
|
Percentage
|
|
Entitlements
|
77%
|
|
Tax Cuts
|
15%
|
|
Unsure
|
8%
|
|
TOTAL
|
100%
|
The economist conducts a survey. She randomly selects 600 adults and asks "which is more important, keeping Medicare, Social Security and Medicaid (entitlements) or tax cuts". The results follow: At alpha= 0.01, are the distributions different?
|
Survey Results
|
|
Response
|
Frequency.f
|
|
Keeping Medicare, Social Security, and Medicaid
|
431
|
|
Tax Cuts
|
107
|
|
Unsure
|
62
|
|
TOTAL
|
600
|
Q6. A researcher wants to determine if a relationship exists between job status (full- or part-time) and two different work arrangements - contract and traditional. The results of a random sample of 884 workers are shown in the following contingency table: Can the researcher use this sample to test for independence using a Chi-Square independence test? Why or why not?
|
|
Work Arrangement
|
|
Status
|
Contract
|
Traditional
|
|
Full-time
|
12
|
720
|
|
Part-time
|
4
|
148
|
Q7. A travel consultant wants to determine whether certain desirable travel features are related to the travel purpose. A random sample of 300 travelers is selected and each is asked for their primary travel feature. The results are shown in the contingency table below. Assuming that the variables travel feature and travel purpose are independent, find the expected frequency for each cell.
a. Calculate the marginal (row and column) frequencies.
b. Determine the sample size.
c. Use the appropriate formula to find the expected frequency for each cell.
|
|
Travel Feature
|
|
Travel Purpose
|
Hotel Rooms
|
Leg Room on Planes
|
Rental Car Size
|
Other
|
|
Business
|
36
|
108
|
14
|
22
|
|
Leisure
|
38
|
54
|
14
|
14
|
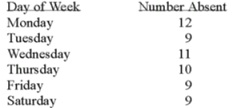
Q8. An HR manager is concerned about absenteeism. She decides to sample the records to determine if absenteeism is distributed evenly throughout the six-day workweek. The null hypothesis to be tested is: Absenteeism is distributed evenly throughout the week. The 0.01 level is to be used. The sample results are:

What is the calculated value of chi-square?