Problem:
The following table depicts the hours per week supplied to a specific market by three (3) individuals at different wage rates. Evaluate the total hours per week (QT) supplied to market.
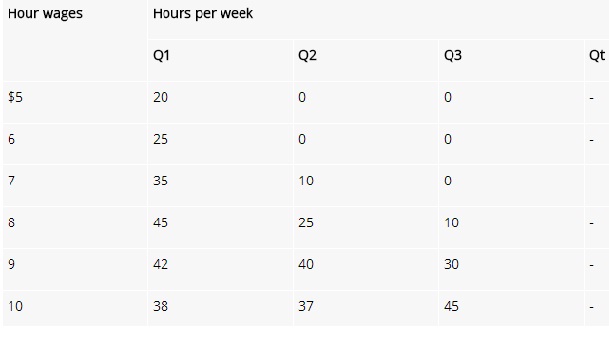
Which individuals, if any, have backward-bending supply curves in wage range shown? Does the market supply curve bend backward in wage range shown in table?