Assignment 1:
Kay Sealey is the news director for KASI-TV, the local NBC affiliate for a large southwestern city. Sealey believes that the most important quality of an on-air news broadcaster is credibility in the eyes of the viewer. Accordingly, surveys are taken every six months that attempt to evaluate the credibility of the news broadcasters who appear on the local news programs. The following shows one of the survey instruments used by the station to measure the credibility of a newscaster:
Evaluate the anchorperson on the news broadcast that you reviewed by completing the following series of scales. Place a check mark on the scale position that most nearly matches your feelings about this anchorperson. For example, if you thought that this anchorperson was extremely likeable, you would place a check mark in the blank nearest “likeable” (in this case, the far left blank).
a. likeable ___ ___ ___ ___ ___ ___ ___ not likeable
b. knowledgeable ___ ___ ___ ___ ___ ___ ___ not knowledgeable
c. unattractive ___ ___ ___ ___ ___ ___ ___ attractive
d. intelligent ___ ___ ___ ___ ___ ___ ___ not intelligent
e. not similar to you ___ ___ ___ ___ ___ ___ ___ similar to you
f. good looking ___ ___ ___ ___ ___ ___ ___ bad looking
g. unexciting ___ ___ ___ ___ ___ ___ ___ exciting
h. confident ___ ___ ___ ___ ___ ___ ___ not confident
i. friendly ___ ___ ___ ___ ___ ___ ___ not friendly
j. not believable ___ ___ ___ ___ ___ ___ ___ believable
k. expert ___ ___ ___ ___ ___ ___ ___ not expert
l. ugly ___ ___ ___ ___ ___ ___ ___ beautiful
m. don’t identify with ___ ___ ___ ___ ___ ___ ___ identify with
n. competent ___ ___ ___ ___ ___ ___ ___ not competent
o. active ___ ___ ___ ___ ___ ___ ___ passive
p. irritating ___ ___ ___ ___ ___ ___ ___ not irritating
q. not trustworthy ___ ___ ___ ___ ___ ___ ___ trustworthy
r. dull ___ ___ ___ ___ ___ ___ ___ interesting
s. not sincere ___ ___ ___ ___ ___ ___ ___ sincere
Suppose that this questionnaire were administered to a sample of 50 people after they had watched a videotape of a nightly news broadcast that featured the specific broadcaster. The responses of 50 people surveyed can be found in the accompanying Excel spreadsheet.
1. Note that items a, b, d, f, h, i, k, n and o need to be reverse-coded before analysis. Carry this step out in the Excel spreadsheet by substracting the scores for these questions from 8. Then import the data into SPSS for factor analysis (you can simply open the Excel file from inside SPSS.)
2. Discuss briefly the possible reasons for the use of factor analysis with these data.
3. Do a principal components analysis (with rotation to ease interpretation) using these data with a five-factor solution. What is the percentage of variance accounted for by each of these factors? What is the total percentage of variance accounted for by the five-factor solution? Why do you think we did not use more factors (e.g., a six-factor solution?)
4. Write a brief interpretation for each of the factors, using the factor loadings for the rotated solution.
Attachment:- assignment-5-mkt-6309-5-data.xls
Assignment 2:
A respondent was presented 18 hypothetical alternatives or profiles described on five attributes. The attributes are:
i) Package Design (described on three levels);
ii) Brand Name (described on three levels);
iii) Price (described on three levels);
iv) Good Housekeeping seal of approval (described on two levels);
v) Money Back Guarantee (described on two levels).
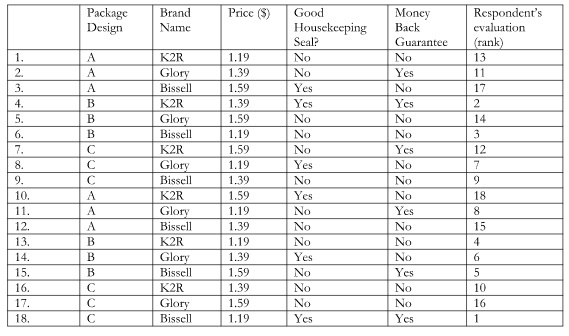
Based on the attributes, 108 possible profiles could be created. This is given by 3x3x3x2x2 = 108. The respondent was given a particular set of 18 and was asked to rank the profiles from most preferred (rank of 1) to least preferred (rank of 18). The data are given in the table below. The first five columns represent the five attributes and the last column is the respondent’s ranking.

Part 1. Code all five attributes (including price) using dummy variables. Show your coding in a table.
Type in the ranks and the dummy variables for each of the 18 profiles into a file (a spreadsheet if that’s what you use to run regressions). Convert the rank orders so that the higher the number the more preferred the object. In the table above, the most preferred object is ranked 1. Simply subtract each rank given in the last column from 19 to get the converted ranks.
Part 2. Run a regression using the rank as the dependent variable and the dummy variables as the predictors. Show your output table with the regression coefficients. The regression coefficients of the dummy variables can be treated as utilities.
Part 3. Calculate the predicted utilities for the following options (you don't need to adjust the part-worths):
i) Package A, K2R, $1.19, no Good Housekeeping seal, no money back guarantee
ii) Package C, Bissell, $1.19, no Good Housekeeping seal with money back guarantee
iii) Package B, Bissell, $1.59, Good Housekeeping seal with money back guarantee.
Part 4. What is the highest predicted utility that can be obtained? What are the characteristics of that option?