1. (a) Consider a strati?ed contingency table analysis to measure the association between a disease (or other outcome) and an exposure, where the i-th (2x�2) table of K is given by
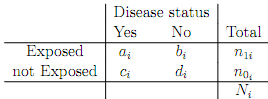
where Ni = n0i + n1i is the total sample size for each table.
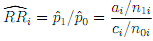
Recall that the estimated relative risk from each table is then
Describe brie?y what the relative risk represents in probabilistic terms. Why is it usual when constructing a con?dence interval for the relative risk to use the standard error of log( ) rather than of directly? Write down an estimate of σ2i = Var(log(), based on the terms in the table, and give the form of the resulting 100(1 - α)% con?dence interval for RRi.
For the remainder of this part of the question you are asked to consider a method for constructing a Mantel-Haenszel (type) estimate of the pooled relative risk from K independent tables.
You may assume that the unconditional likelihood of the i-th table is given by

so that if the relative risk ψ = RRi is common to all tables, then ψi = pli/p0i = ψ for all i.
(ii) Make a suitable substitution to obtain the likelihood for the i-th table in terms of ψ, and hence show that the overall log-likelihood (for K tables), is given by
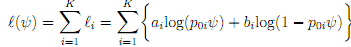
(if we consider only those terms involving ψ).
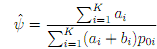
Hence, show that the maximum likelihood estimator of ψ, is given by

What assumption was necessary to give the estimator in this form?
Now substitute ˆp01 = ci/n0i = ci/(ci + di), to obtain
The estimator of ψ is more usually given in the form
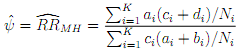
Under what assumption is it reasonable to replace n0i from the solution in part (c) with Ni in (��)? What nice properties does the Mantel-Haenzsel estimator given by (��) share with the equivalent version for the odds-ratio? [3]
(b) A retrospective cohort study involving 248 children enrolled within one LEA area was undertaken to investigate a possible link between neurological impairment (measured by decreased reaction times) at age 11 and exposure to secondary (‘passive') smoking in the home. Those classed as being exposed to secondary smoking were those who were identi?ed as having been exposed from birth until they were at least seven years old. The data are summarised in the Table below.
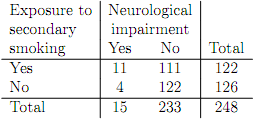
(i) Estimate the relative risk of neurological impairment for children exposed to secondary smoking, and calculate a 95% con?dence interval for this risk.
(ii) Perform a formal test of no association between neurological impairment and secondary smoking for these data. What are your conclusions based on this analysis?
(iii) It is possible that the results above are biased, since it is known that many in the exposed group suffering impairment were from urban areas, while in the unexposed group many of those who showed no signs of impairment were from rural areas. What type of bias might this indicate, and how could its effect have been controlled in the study?
Attachment:- ASSIGN.pdf