Elasticity and Total Revenue:
Question 1) Consider the demand equation P = 3/QD + 1, where P is the price in dollars and QD is the quantity demanded.
a.) Plot the demand curve qualitatively (you may plot a few points and then fill in the general shape from there, because the line is nonlinear). Does this demand curve obey the law of demand?
b.) For what region on this curve is demand elastic? Where is demand inelastic? Note, some of you may solve this question using the brute force of calculus, but it is actually much easier without calculus. Instead, use a total revenue argument. You may find it helpful to make a graph relating quantity to total revenue measuring quantity on the horizontal axis and total revenue on the vertical axis.
Question 2) Bledi and Nisha are the only consumers in the market for pet turtles. Their demands are described below, where P is the price in dollars and Q is the number of turtles.
Bledi: QD = 12 - (8/3)P
Nisha: QD = 6 - (1/3)P
a.) Plot the individual demand curves and the market demand curve in three separate graphs (you will find it helpful to align these three graphs horizontally as we did in class). Label each graph carefully and completely.
b.) Plot, qualitatively, the total revenue corresponding to the market demand as a function of price. That is, draw a graph measuring total revenue on the vertical axis and price on the horizontal axis. Completing the table below and then plotting the points (price, total revenue) will help you construct this graph. From these points you found in the table, use your knowledge of elasticity to help fill in the general shape of the line that represents the relationship between price and total revenue (hint: don’t expect this line to be linear!).

c.) Where is total revenue maximized? Label this on your graph from part (b). CPI/Inflation/Nominal/Real
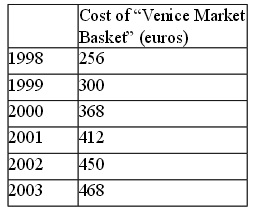
Question 3) Serena Van der Woodsen spends her summer vacation in Venice every year. Although her budget is generally unlimited thanks to her trust funds and thus she doesn’t have to worry about the prices of the goods she consumes, she is quite interested in how the cost of living has changed over time. Serena decides to make a table that provides the cost of her “Venice market basket” over time: here is the data she collects.

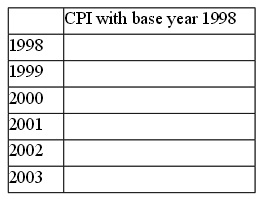
a) Using 1998 as the base year, compute the CPI based on the “Venice market basket” and a 100 point scale. In your answer provide the general formula for the CPI in a specific year and then place your calculations in a table like the one below. Round the CPI figures you calculate to the nearest whole number.

b) With base year 1998, compute the rate of inflation from 2000 to 2001 using the CPI with base year 1998 as the inflation index for this computation.
c) If the real price for high heels sold in Venice in 1999 was 55 euros per pair, what is the nominal price of high heels in Venice based on the CPI calculated using the “Venice market basket?” Carry your answer out to two places past the decimal.
d) Describe a way to figure out if the cost of living in Venice is higher than that in Paris.
Question 4) Blair Waldorf lives in Manhattan along with her friend Dorota. Blair has asked Dorota to help her analyze the cost of living on the upper east side of Manhattan. Dorota obliges and collects the following data about the nominal prices of typical products upper east side residents consume. The following table summarizes the data she has collected.

a) Assuming that the upper east siders typically consume 5 hairbands, 6 dresses and 8 handbags, compute the cost of the basket. Consolidate your calculations in a table like the following one.
b) Suppose Blair, while reviewing the data, realizes that there is an error for the nominal price of hairbands in 2001. She does not know the nominal price of hair bands in 2001 but she does know that the correct inflation rate from 2000 to 2001is 50% using 2000 as the base year. From this information calculate the correct nominal price for hairbands in 2001.
Consumer Theory
5) Rawls considers left and right shoes to be perfect complements (that is, Rawls always wears both a left shoe and a right shoe). For some reason, his local shoe store sells left and right shoes separately.
a) Plot Rawls’ indifference curves. Put left shoes on the x-axis and right shoes on the y-axis.
b) Suppose Rawls owns 3 right shoes and 3 left shoes. He then inherits 10 left shoes from his Uncle Wilson (Wilson had two left feet). What is the marginal utility of each of these 10 left shoes? Instead, now suppose Rawls has $30 to spend on any combination of left shoes, right shoes, and pairs of socks. Left shoes cost $2 each, right shoes cost $3 each, and socks cost $1 for each pair.
c) Rawls has preferences over all three of these goods. This means we have a utility function of three variables, U(x,y,z). Argue that we can simplify this into a function of just two variables by reinterpreting two of these goods to be just one good. Then draw Rawls’ budget line for these two goods. Put the combined two-in-one good on the x-axis, give it a name, and put the other good on the y-axis.
d) What is the slope of the budget line? What is the meaning of this number?
e) Suppose Rawls has a utility function of U(x,y) = xy, where x is the quantity of the combined good from part (c) and y is the quantity of the remaining good (hint: we are being vague with the names of these goods because we don’t want to give you the answer to (c)-but, you should name them more clearly in your answer!). The marginal utility of good x is MUx=y. The marginal utility of good y is MUy=x. In what ratio will Rawls purchase these goods? Given his income of $30, how many will he buy of each if we assume that Rawls seeks to maximize his utility from consuming these goods given his tastes and preferences and his income?
f) Now, suppose the price for the pair of shoes changes from $5 to $2.5. Holding everything else constant, what is Rawls’ new consumption point that will maximize his satisfaction? Draw your new budget line and identify the new utility maximizing point. Assume goods to be divisible.
g) Now, in your graph, identify the substitution effect and the income effect with respect to Rawls’ consumption of pair of shoes. How do each of these effects affect the change in the quantity of pairs of shoes consumed by Rawls when the price of a pair of shoes changes? In your answer, numerically analyze each effect and give economic interpretations for these two effects. Don’t be surprised if you end up with some “challenging” numbers in this exercise!
h) Does Rawls’ choice of consumption for the pair of shoes obey the law of demand? (Hint: draw a graph of Rawls’ demand curve for the various price changes you have been given.)
6) Let’s return to just the market for left shoes (x) and right shoes (y) for Rawls. Rawls considers left and right shoes to be perfect complements (that is, Rawls always wears both a left shoe and a right shoe, or mathematically speaking x = y). For some reason, his local shoe store sells left and right shoes separately. Suppose Rawls has $30 to spend on any combination of left shoes and right shoes. Left shoes cost $2 each and right shoes cost $3 each.
a) Draw Rawls’ indifference curves together with the budget line and graphically find the optimal consumption point for Rawls given the above information.
b) Numerically solve for Rawls’ optimal consumption point given the above information.
c) Suppose the price of a left shoes increases from $2 to $3. Given this information, what is the new optimal consumption bundle? Indicate the changes in your graph in (a) and interpret your results in terms of the income effect and the substitution effect.
7) Now let’s consider Rawls’ brother John and his preferences with regard to flip-flops (measured on the x-axis) and sandals (measured on the y-axis). John considers flip-flops and sandals to be perfect substitutes for one another: that is, from John’s perspective he is perfectly indifferent between a pair of flip-flops and a pair of sandals. In other words, John considers 1 pair of flip-flops as providing exactly the same satisfaction as 1 pair of sandals.
a) Given the above information draw a graph that illustrates at least three different indifference curves for John with flip-flops measured on the x-axis and sandals on the y-axis. Draw John’s indifference curves over flip-flops and sandals, with putting flip-flops on the x-axis.
b) Suppose that John has $30 to spend on sandals and flip-flops and that flip-flops cost $5 a pair while sandals cost $6 a pair. Given this information determine John’s budget line in equation form and then solve to find John’s optimal consumption bundle for sandals and flip-flops.
c) Suppose John got an extra source of income and now has $50 instead of $30 to spend on sandals and flip-flops. Holding everything else constant how does this change John’s optimal consumption bundle?
d) Go back to John’s original income, which is $30, and consider a price change for flip-flops: suppose that flip-flops now cost $6 per pair instead of the original $5 per pair. Holding everything else constant how does this price change alter the optimal consumption bundle for John?
8) Mrs. McGillicuddy spends her money on only two things, apple pie and prescription drugs. On Medicare, her prescription drug costs are subsidized according to the following schedule. Medicare covers 50% of initial drug costs until Mrs. McGillicuddy incurs an out-of-pocket expense of $10. Then Medicare covers 0% of the drug costs for her next $10 in prescription drug expenses. For any remaining expenses, Medicare will cover 80% of the cost. Suppose Mrs. McGillicuddy has $30 to spend and that apple pies cost $1.
a) Suppose Mrs. McGillicuddy spends $10 on prescription drugs, and the rest of her income on apple pie. How many apple pies will she have? What will be the dollar value of her prescription drug purchase?
b) Plot Mrs. McGillicuddy’s budget line measuring apple pies on the vertical axis and the dollar value of prescription drugs on the horizontal axis. Your budget line should have two kinks (this is a more complicated problem then you saw in class lecture-so be prepared to have to think hard on this one). Label the kinks and the slopes. What do the kinks signify?