I. Binary choice (5 questions)
Use the following figure to answer the next question.
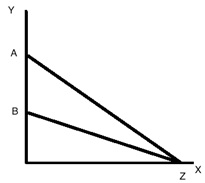
Problem 1. In the above figure, as X increases, Y decreases faster on
a) Line AZ.
b) line BZ.
Problem 2. As the economy recovers from a recession income rises; that means that the demand for a normal good, like shoes, will increase. Thus, recovery from a recession implies that the demand curve for shoes will shift to the
a) Right.
b) Left.
Problem 3. Suppose a crisis in the Middle East causes the price of oil to rise. Other things equal, in the market for cars, this would:
a) Increase the number of cars people bought.
b) Reduce the number of cars people bought.
Problem 4. The price of cotton was 16.8 cents per pound on January 2, 1929,12.6 cents per pound on January 2, 1930, and 8.4 cents a pound on January 2, 1931. The percentage decline in price from 1929 to 1930 was
a) Larger than the percentage decline from 1930 to 1931.
b) Smaller than the percentage decline from 1930 to 1931
Use the following figure to answer the next question.
Assume that the price difference between Pa and Pb is the same as the price difference between Pc and Pd. Furthermore, assume that the quantity difference between Qa and Qb is the same as the quantity difference between Qc and Qd.
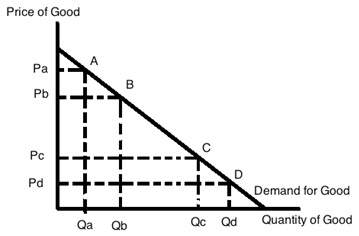
Problem 5. In the above figure compare the percentage increase in the quantity demanded when the price decreases from PA to PB, with the percentage increase in quantity demanded when the price decreases from PC to PD. Which of the following statements is correct?
a) The percentage increase in quantity is greater from the fall in prices from Pa to Pb than from the fall in prices from Pc to Pd.
b) The percentage increase in quantity is less from the fall in prices from PA to PB than from the fall in prices from Pc to Pd.
II. Multiple Choice (20 questions)
Use the following figure to answer the next question.
Assume that the line depicted in the picture is a straight line.
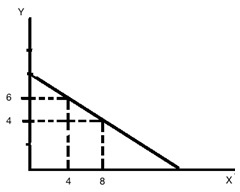
Problem 6. Given the above figure, the Y intercept of this line is _____ and the X-intercept is _____.
a) 8, 12
b) 12, 8
c) 16, 8
d) 16, 16
e) 8, 16
Use the following information, including Table, to answer the next question.
Hannah is a student taking psychology, political science, and economics; she also works for $10 an hour. She is planning her schedule for a new semester, and decides to limit total time spent on academics plus work to 44 hours a week. For each course she has estimated how many hours she needs to devote to each course to get an A and how many hours she needs to devote to each course to get a B. Based on her estimates, she draws up the following two choices.
|
|
Choice 1
|
Choice 2
|
|
|
Grade
|
Hours
|
Grade
|
Hours
|
|
Psychology
|
A
|
11
|
A
|
11
|
|
Political Science
|
B
|
12
|
A
|
15
|
|
Economics
|
A
|
11
|
B
|
9
|
|
Total academic hours
|
|
34
|
|
35
|
|
Work hours
|
|
10
|
|
9
|
|
Total hours
|
|
44
|
|
44
|
|
|
|
|
|
|
|
Problem 7. What is the dollar value of the opportunity cost of Hannah deciding on choice 2 instead of choice 1?
a) $44
b) $9
c) $10
d) $35
Problem 8. Joey is trying to come up with a list of variables that will cause the demand curve to shift if the variable changes. Which of the following choices is the best list for Joey?
a) Income, wealth, taste and preferences
b) Supply of the good, price, quantity
c) Price of complements in consumption, price of substitutes, number of firms in the industry
d) Price of substitutes in consumption, wealth, level of technology
Problem 9. Margery knows that the supply curve for gadgets has shifted due to a change in a determinant of supply. Margery is asked to pick one of the following lists as the "best" list of some of the determinants of supply that could have changed.
a) Number of firms in the industry, price of substitutes in consumption, weather
b) Price of inputs, level of technology, number of firms in the industry
c) Weather, tastes and preferences, price of inputs
d) Price of inputs, price of substitutes in consumption, number of firms in the industry
Use the following figure to answer the next question.
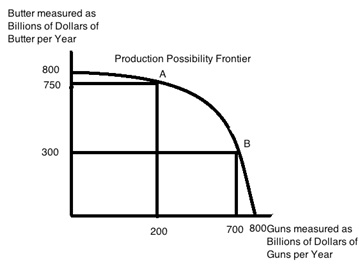
Problem 10. Refer tothe above figure. It shows the production possibility frontier (PPF) for Guns (military spending) and Butter (domestic spending) in the U.S. Economy. The opportunity cost of increasing spending on Guns from 200 to 700 billion dollars a year is
a) Giving up $300 Billion/year of Butter.
b) Giving up $450 Billion/year of Butter.
c) Giving up $750 Billion/year of Butter.
d) The same as increasing spending on guns by $500 billion starting from any point on the PPF.
e) Giving up $500 Billion/year of Butter.
Problem 11. An increase in the quantity demanded, occurs from a _______ if the price _________ .
a) Movement along the demand curve; remains constant
b) Movement along the demand curve; increases
c) Shift in the demand curve to the left; increases
d) Shift in the demand curve to the right; remains constant
Problem 12. If the demand curve and the supply curve for a good both shift to the right, then the output of this good ______ and the price of this good __________.
a) Increases, indeterminate
b) Increases, increases
c) Increases, decreases
d) Is indeterminate; is indeterminate
e) Is indeterminate; increases
Use the information below to answer the next three questions.
|
Table
|
|
Ben's and Rhonda's Individual Production Capability
(numbers are in pounds)
|
|
Ben
|
Rhonda
|
|
Cherries
|
Grapes
|
Cherries
|
Grapes
|
|
0
|
80
|
0
|
50
|
|
40
|
0
|
75
|
0
|
Problem 13. Ben's opportunity cost for producing one cherry is _______ grapes, and Rhonda's opportunity cost for producing one cherry is _____ grapes, so __________ has a comparative advantage in producing cherries.
a) 2/3, 2, Ben
b) 2, 2/3, Rhonda
c) 2, 2/3 Ben
d) 2/3, 2, Rhonda
e) 2, 1.5 Ben
Use this figure and the above information to answer the next question.
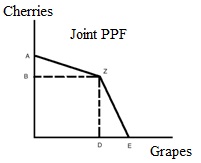
Problem 14. In the above figure the path AZE is the joint production possibility frontier for Ben and Rhonda. What are the numerical coordinates for the three points, A, Z, and E, respectively, where the coordinates are (GRAPES, CHERRIES).
|
Multiple Choice Answer
|
Coordinates for Point A
|
Coordinates for Point Z
|
Coordinates for Point E
|
|
a)
|
(0, 115)
|
(80, 75)
|
(130, 0)
|
|
b)
|
(0, 40)
|
(80, 75)
|
(50, 0)
|
|
c)
|
(80, 0)
|
(50, 80)
|
(50, 0)
|
|
d)
|
(80, 0)
|
(80, 75)
|
(50, 0)
|
|
e)
|
(120, 0)
|
(120, 125)
|
(0, 125)
|
Problem 15. Given the above information, if Ben and Rhonda each specialized in their comparative advantage, then the trading range for the price for a pound of grapes would be____ , and the trading range for the price of a pound of cherries would be ________.
a) between 1/2 pound of cherries and 2/3 pound of cherries; between 1/3 pound of grapes and 2 pounds of grapes
b)between 1/2 pound of cherries and 1.5 pounds of cherries; between 2/3 pounds of grapes and 1.5 pounds of grapes
c)between 1/2 pound of cherries and 2 pounds of cherries; between 1 pound of grapes and 1.5 pounds of grapes
d)between 2/3 pounds of cherries and 2 pounds of cherries; between 1/3 pound of grapes and1.5 pounds of grapes
e) between 1/2 pound of cherries and 3/2 pounds of cherries; between 2/3 pounds of grapes and 2 pounds of grapes
Use the figure below of the market for widgets to answer the next two questions.
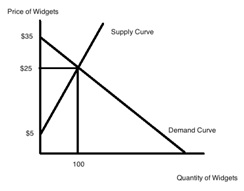
Problem 16. Consumer surplus in the market for widgets is equal to:
a) $50
b) $2,500
c) $1,750
d) $1,000
e) $500
17. Producer surplus in the market for widgets is equal to:
a) $(35 * 100)
b) $(35 * 100 * 0.5)
c) $500
d) $1000
e) $2,000
Use the figure below and the provided information to answer the next question.
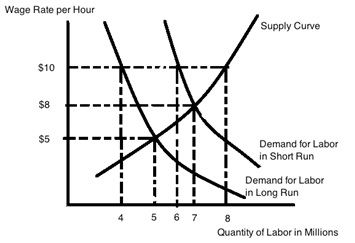
In the above figure the labor market for fast food workers is depicted. The figure provides two demand curves for labor: the demand curve for labor in the short run and the demand curve for labor in the long run. In the short run, fast food restaurants do not have alternatives about how to operate their restaurants: their demand for labor is inelastic. (For example, McDonalds will hire about the same number of people in the short run even if wages increase because the restaurants are set up to need a certain number of people to serve the customers they have.) In the long run, McDonald's and other fast food restaurants can reduce their hiring of labor by changing how they operate and adopting less labor-intensive practices. This is reflected in the demand for labor in the long run curve in the above graph.
Currently the wage rate in this market is $8, but the government is considering a law requiring a minimum wage of $10 per hour. If this law passes, then in the short run the fast food restaurants will hire dependent on their demand for labor in the short run, but in the long run the fast food restaurants will hire dependent on their demand for labor in the long run.
Problem 18. If the $10 minimum wage is implemented in this labor market, compared to the level of employment prior to the implementation of this law, employment in this market will fall by _____ million in the short run and by ______million in the long run.
a) 1; 2
b) 1; 3
c) 2; 2
d) 1; 1
e) 3; 2
Use the table below of the U.S. gasoline market to answer the next question.
|
Supply and Demand for Gasoline in the United States
|
|
Price/Gallon
|
Demand*
|
Supply*
|
|
$4.20
|
350
|
440
|
|
$4.00
|
375
|
420
|
|
$3.80
|
400
|
400
|
|
$3.60
|
425
|
380
|
|
$3.40
|
450
|
360
|
*Units are 100,000 gallons/day
Problem 19. Suppose the gasoline market is in equilibrium. Then if the government imposes a price ceiling of $3.40 a gallon, we would expect to see:
- the output in the market _________ to ___________gallons/day,
AND
- there will beanof_______of ___________gallons/day.
a) increase; 360,000,000; excess supply; 40,000,000
b)decrease;360,000,000; excess demand; 90,000,000
c) decrease; 360,000,000; excess supply; 90,000,000
d) increase; 450,000,000; excess supply; 90,000,00
Problem 20. The ability to obtain student loans backed by the federal government allowed many students to go to college who otherwise might not have attended. At the same time, the supply of places in college has been fairly inelastic (that is, as the price of going to college increases the quantity of spots available has hardly budged). The supply and demand model would predict that the effect of creating government-backed loans would be ___________, and the price of college would ________.
a) A shift to the right of the demand curve; increase
b) A shift to the right of the demand curve; decrease
c) A shift to the left of the demand curve; increase
d) A shift to the left of the demand curve; decrease
e) No shift in the demand curve; stay the same
Use the following table to answer the next question.
|
Price
|
Quantity Demanded by
One Person
|
|
$20
|
1
|
|
$18
|
2
|
|
$16
|
3
|
|
$14
|
4
|
Problem 21. During the Final Four basketball tournament, market research determined that 10,000 students at UW would like to buy a Final Four T-Shirt. Each of them has the same preferences: if the price is $20 he would by one for himself, if the price was $18 he would also buy one for a friend, if the price was $16, he would buy one for himself and two others for gifts, and if the price was $14, he would buy one for himself and three more for gifts.For the prices of $20, $18, $16, and $14, the total market demand would be, respectively:
a) 20,000; 36,000; 48,000; 56,000
b) 200,000; 180,000; 160,000; 140,000
c) 1/10,000; 2/10,000; 3/10,000; 4/10,000
d) 10,000; 20,000; 30,000; 40,000
e) 20/10,000;36/10,000;48/10,000;56/10,000
Use the table below for the next question.
|
Siena City Market for "Happy Beef"
|
|
Price/pound*
|
QS(A)
Pounds*
|
QS(B)
Pounds*
|
QS(C)
Pounds*
|
|
$4.50
|
5,000
|
2,500
|
2,000
|
|
$3.00
|
4,000
|
2,000
|
1,500
|
|
$2.50
|
3,000
|
1,500
|
1,000
|
|
$2.00
|
2,000
|
1,000
|
500
|
*Hanging weight at the butcher's.
Problem 22. Threefarms--Farm A, Farm B, and Farm C--in the area around Siena City supply "happy beef"-beef from cows who have lived in a local pasture their entire life instead of living in several different large, specialized operations far away. The table above shows how many pounds of beef each farm would supply each year depending on the price. The MARKET supply curve, for the prices $4.50, $3.00, $2.50, $2.00, respectively is given by the quantities, in pounds of ___________. If the market price is $3.00 in this market, then the total revenue from selling beef for these three farms will be ________.
a) 9500; 7500; 5500; 3500; $22,500
b) 10,000; 7500; 5000; 3500; $22,500
c) 9500; 7500; 5500; 3000; $21,000
d) 9500; 7000; 5500; 3500; $21,000
Problem 23. A university currently has a Meal Plan A, which provides 19 meals a week (no Saturday or Sunday evening meal) for a fixed fee per semester. The meal plan provides lots of choices of dishes at each meal and the meal planoffers meals at a wide range of times. The University is considering also offering a Meal Plan B, which would be like the current Plan A, except that Plan B would have very limited number of choices at breakfast and lunch and no choice at dinner (there would still be dinner, but there would be only one choice at dinner). Meal Plan B would cost 30% less than Plan A.
Plan B would be a ___________ for Plan A. Implementing Plan B would ___________for Plan A, and cause the price of Plan A to __________.
a) complement;shift the demand curve to the right; stay the at its initial level
b) substitute; shift the demand curve to the left; decrease from its initial level
c)complement; shift the demand curve to the left; decrease from its initial level
d)substitute; shift the demand curve to the right; increase from its initial level
e)substitute; shift the demand curve to the left; increase from its initial level
Use the figure below to answer the next two questions.
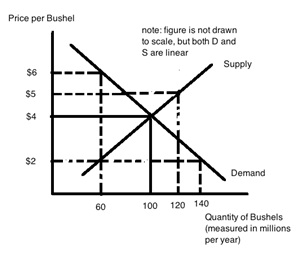
Problem 24. The equilibrium for the corn market without any intervention is a price of $4 per bushel and output of 100 million bushels per year. Suppose Congress then enacts a law setting a price floor of $5 a bushel. The result is that farmers will produce _______ million bushels, buyers will buy ______ million bushels and there will bean __________ million bushels.
a) 120; 80; excess demand of 40
b) 80; 120; excess supply of 60
c) 100; 60; excess supply of 40
d) 60; 100; excess demand of 80
e)120; 80; excess supply of 40
Problem 25. The equilibrium for the corn market without any intervention is a price of $4 per bushel and output of 100 million bushels. Then Congress enacts a law telling farmers that the government will guarantee a $5 price in the market. How large a subsidy will the government need to pay per bushel given this guarantee and the above graph? The subsidy will need to be
a) $5 per bushel of corn
b) $2 per bushel of corn
c) $3 per bushel of corn
d) $1 per bushel of corn
III. Problems (two problems)
1. Use the following table to answer this question. The table provides information about the production possibility frontier for Sam and Clara. Both Sam and Clara produce beans and peanuts and they both have linear PPFs.
|
Numbers are in pounds
|
|
Sam
|
Clara
|
|
Beans
|
Peanuts
|
Beans
|
Peanuts
|
|
40
|
0
|
60
|
0
|
|
0
|
60
|
0
|
30
|
a. In the space below draw two graphs. In the first graph depict Sam's PPF and in the second graph depict Clara's PPF. For each graph put pounds of beans on the vertical axis and pounds of peanuts on the horizontal axis. Make sure each graph is completely labeled for full credit: name of producer, axis labeled, intercepts of axis labeled.
b. Who has the comparative advantage in the production of beans? Explain your answer clearly for full credit.
c. Who has the comparative advantage in the production of peanuts? Explain your answer clearly for full credit.
d. Draw the Joint PPF, and label it completely and carefully in the space below. Measure beans on the vertical axis and peanuts on the horizontal axis. Mark sure that any "kink" points are identified and their coordinates provided.
e. If Sam and Clara each specialized completely in producing the good in which they had a comparative advantage, what point on the graph would mark this point? (Provide the coordinates (Pounds of Peanuts, Pounds of Beans) for this point.)
f. If Sam produces 15 pounds of peanuts, what is the maximum amount of pounds of beans that Sam and Clara can produce? Show how you found your answer for full credit.
g. In the space below depict the range of trading prices for 10 pounds of beans in terms of pounds of peanuts on a number line. Indicate both Sam's perspective and Clara's perspective on this number line.
2. Use the table below in answering this problem.
|
Market Price ($ per Ton)
|
Quantity Demanded by Current Customers (measured in tons)
|
Quantity Supplied by Current Firms (measured in tons)
|
Quantity that would be Supplied by Potential New Firm in the Market (measured in tons)
|
|
50
|
13
|
17
|
2.3
|
|
45
|
14
|
16
|
2.2
|
|
40
|
15
|
15
|
2.1
|
|
35
|
16
|
14
|
2.0
|
|
30
|
17
|
13
|
1.9
|
|
25
|
18
|
12
|
1.8
|
a) Given the above information what is the equilibrium market price and equilibrium market quantity? Assume that the potential new firm has not entered this market.
b) In your own words provide a verbal analysis of the impact on this market of the entry of the potential new firm into this market. Be specific in your answer.
c) Given the information in the above table, if the potential firm enters the market what will be the new equilibrium price and new equilibrium quantity in this market?
d) Suppose that entry of this new firm has occurred in this market. Now, the government decides to implement a price ceiling in this market. In order for this price ceiling to be effective, what must be true about the price ceiling? Be specific in your answer.
e) Suppose the price ceiling described in (d) is set at $25 a ton. Analyze the impact of this price ceiling on this market. In your answer be sure to quantify any excess supply or demand that occurs. Also, in your answer identify which side of the market is the "short side".
f) Given the price ceiling described in (d) and (e), determine the amount of revenue suppliers of this good will earn in total when this price ceiling is implemented. Show how you found your answer.