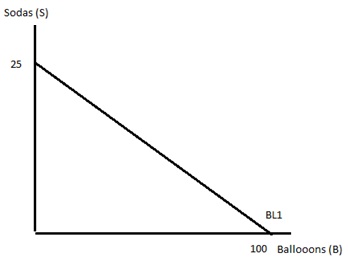
Problem 1. Libby’s income is $100 and she uses all of her income to purchase balloons and sodas. Use this information and the graph below to answer this set of questions.

a) Given the above information and the figure, what is the price of a balloon?
b) Given the above information and the figure, what is the price of a soda?
c) Write an equation in slope-intercept form for Libby’s budget line.
d) Suppose that Libby maximizes her utility given budget line 1 when she selects a bundle that includes 20 sodas.
i. How many balloons are in this optimal consumption bundle?
ii. On the graph indicate this optimal consumption bundle and label it bundle A. Identify numerically on the graph the quantity of balloons and the quantity of sodas associated with bundle A.
iii. Draw an indifference curve (IC1) on the graph such that bundle A represents the utility maximizing bundle for Libby.
e. Suppose the price of balloons doubles. On the graph draw BL2 given this new information.
f. Given BL2, can Libby still consume bundle A? Explain your answer.
g. On BL2 identify a bundle of sodas and balloons that could represent the new utility maximizing choice for Libby and label this bundle B. Identify the quantity of sodas (S2) and the quantity of balloons (B2) Libby will choose to consume given this consumption bundle B.
h. Draw in BL3, the imaginary budget line that adjusts the income of Libby so that she is now paying the new prices for the two goods, while she is still getting the level of utility she had initially. Label this budget line and identify bundle C, the bundle of sodas and balloons she would choose to consume on BL3 given her tastes and preferences
i. On the graph identify the substitution effect and the income effect. Describe in words what these two effects are in the space below.