Assignment:
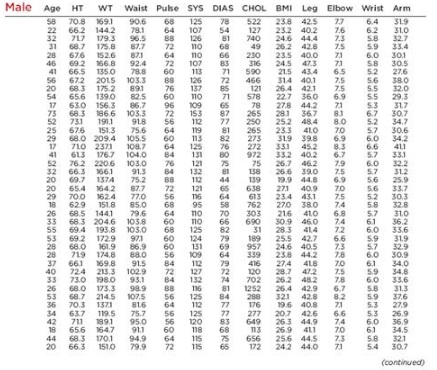
Residual Plot Refer to Data Set 1 in Appendix B and use the paired data consisting of the first six pulse rates and the first six systolic blood pressures of males. Construct the residual plot. Does the residual plot suggest that the regression equation is a bad model? Why or why not? Does the scatter diagram suggest that the regression equation is a bad model? Why or why not?
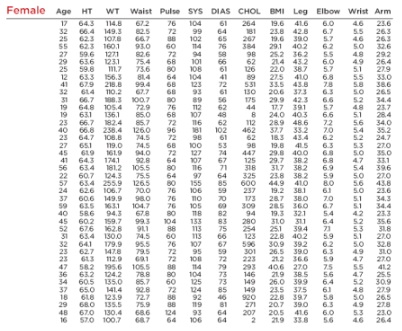
Data Set: Health Exam Results
AGE is in years, HT is height (inches), WT is weight (pounds), WAIST is circumference (cm), Pulse is pulse rate (beats per minute), SYS is systolic blood pressure (mm Hg), DIAS is diastolic blood pressure (mm Hg), CHOL is cholesterol (mg), BMI is body mass index, Leg is upper leg length (cm), Elbow is elbow breadth (cm), Wrist is wrist breadth (cm), and Arm is arm circumference (cm). Data are from the U.S. Department of Health and Human Services, National Center for Health Statistics, Third National Health and Nutrition Examination Survey.
|
STATDISK:
|
Data set name for males is M health.
|
|
Minitab:
|
Worksheet name for males is MHEALTH.MTW.
|
|
Excel:
|
Workbook name for males is MHEALTH.XLS.
|
|
TI-83/84 Plus:
|
App name for male data is MHEALTH and the file names are the same as for text files.
|
|
Text file names
|
MAGE, MHT, MWT,
|
|
for males:
|
MWAST, MPULS, MSYS,
|
|
|
MDIAS, MCHOL, MBMI,
|
|
|
MLEG, MELBW, MWRST,
|
|
|
MARM.
|

Data Set: Health Exam Results (continued)
Female
|
STATDISK:
|
Data set name for females is F health.
|
|
Minitab:
|
Worksheet name for females is FHEALTH.MTW.
|
|
Excel:
|
Workbook name for females is FHEALTH.XLS.
|
|
TI-83/84 Plus:
|
App name for female data is FHEALTH and the file names are the same as for text files.
|
|
Text file names for females:
|
FAGE, FHT, FWT, FWAST, FPULS, FSYS, FDIAS, FCHOL, FBMI, FLEG, FELBW, FWRST, FARM.
|
