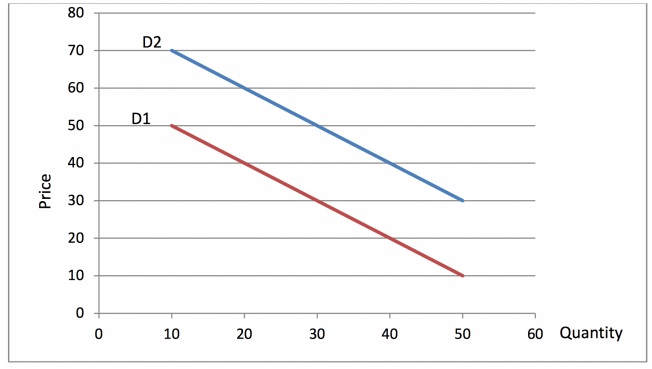
Assignment:
Economic Application: Graphic Analysis for this assignment. The graph shows an increase in demand (shifting of the demand curve from D1 to D2). Choose an application or situation in the economy or a specific economic situation to describe this graph. Take into consideration the impact on quantity and price in your analysis.
Given your analysis, what would cause the situation to go the opposite way? What would cause the situation to go further into the same direction?
Your paper should be double spaced, 12 Times New Roman Font, between 2 to 3 pages, not including a title page and reference page. It is important that your answer is justified and supported with substantial research, examples and opinion. A brief introduction and conclusion should be included in your answer.
Point Breakdown
Interpretation of Graph
Integration of Example
Integration of Subjective Economic Analysis
Integration of Research to Validate and Justify
Integration of Faith/ Ethics
Organization and Structure
Grammar, Spelling
Introduction and Conclusion
