Discussion:
Q1: For normal distribution with mean = 60 and standard deviation = 6, determine the probability content of the interval [62 to 67]
Q2: The table below gives the deviation of a hypothetical portfolio's annual total return (gross of fees) from its benchmark's annual returns, for a 12-year period ending in 2003.
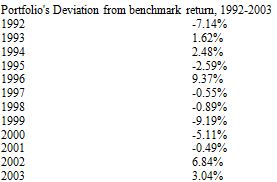
(1) Calculate the frequency, cumulative frequency, relative frequency, and cumulative relative frequency for the portfolio's deviation from benchmark return, given the set of intervals in the table below
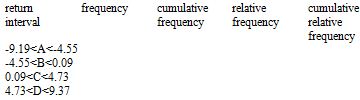
(2) Construct a histogram using the data. Identify the modal interval of the grouped data. Tracking risk (also called tracking error) is the standard deviation of the deviation of a portfolio's gross-of-fees total returns from benchmark return. Calculate the tracking risk of the portfolio, stated in percent (give the answer to two decimal places).