Assignment:
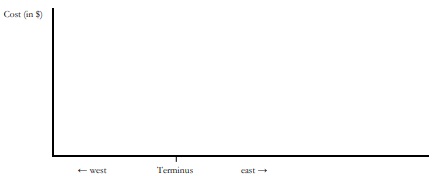
1. End of Line The city of Terminus lies at the western end of a rail line. To the east are a hundred miles of wide plains along which there are several towns-all connected to Terminus by the rail line. To the west of Terminus are fifty miles of mountains, whose small villages are connected by a few winding dirt roads.
The only factory in the region is in Terminus. It produces widgets at a cost of $10 per unit at the factory door. Thanks to the rail line, the transport cost to anywhere east of Terminus is $0.10 per mile. Given the poor state of the roads through the mountains, the transport costs to anywhere west of Terminus is $0.40 per mile.
a. Graph the costs of widgets produced throughout the entire 150-mile region. Carefully label the costs at the factory, at the far western end of the region, and at the far eastern end of the region.
b. Assume that the cost of making a widget at home is $18. What is the market area for the factory? (That is, how many miles west of Terminus will it stretch, and how many miles east of Terminus will it stretch?) Show your work.
In reality, one of the key inputs for widgets is easier for the residents of the eastern plains to acquire. For all remaining parts of the problem, assume that the cost of making widgets at home anywhere east of Terminus is actually $16, and the cost of making widgets at home is $20 anywhere west of Terminus.
c. Now what is the market area for the factory? (That is, how many miles west of Terminus will it stretch, and how many miles east of Terminus will it stretch?) Show your work.
The owners of the factory would like its market area to extend more broadly, and they are considering two investment options:
• First, they could help the government of the region finance the upgrading and paving of the mountain roads, which would reduce the transport costs west of Terminus to only $0.20 per mile. (The transportation costs east of Terminus would stay at $0.10 per mile.)
• Second, they could purchase and install in expensive new equipment in the factory that would reduce the cost of a widget at the factory door to only $8 per unit.
Each of these options would cost exactly the same, and the owners of the factory can choose only one of these options. Assume that potential customers for widgets are distributed evenly across the entire 150-mile region.
d. How many additional miles (on either side of Terminus) would be added to the factory's market area under the first investment option of upgrading and paving the mountain roads? Show your work.
e. How many additional miles (on either side of Terminus) would be added to the factory's market area under the second investment option of installing new equipment in the factory? Show your work.
f. Given the answers to parts d) and e) above, which investment option will the factory owners choose? Briefly explain why they will go with that option.
2. Making Beer and Wine Consider the locations of breweries and wineries.
a. Most breweries locate close to their customers and far from their primary input sources. Based on our discussion of market-oriented and materials-oriented firms explain why that is usually the case.
b. Most wineries locate close to their primary input sources and far from their customers. Based on our discussion of market-oriented and materials-oriented firms explain why that is usually the case.
3. Contemplating Clustering. Consider an entrepreneur who sells jewelry for $50 per piece.
Clustering with similar entrepreneurs would increase labor costs, but it would allow some of the intermediate materials to be made at larger scales, thus reducing per-unit costs.
a. Fill out the rest of the table below, finding the total cost per piece as well as the profit per piece for an entrepreneur depending on how many other entrepreneurs there are in a cluster.
|
Number of entrepreneurs
|
1
|
2
|
3
|
4
|
5
|
6
|
7
|
|
Labor cost per piece
|
5
|
6
|
8
|
11
|
15
|
19
|
27
|
|
Cost of materials per piece
|
25
|
20
|
16
|
14
|
12
|
10
|
9
|
|
Total cost per piece
|
|
|
|
|
|
|
|
|
Profit per piece
|
|
|
|
|
|
|
|
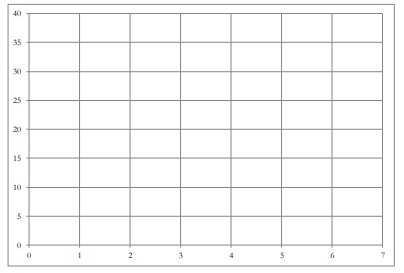
b. Using the data in the table above graph the labor costs per piece, the costs of materials per piece, and the total costs per piece as functions of the number of entrepreneurs in a cluster. Carefully draw and label each of these three separate functions in your graph.
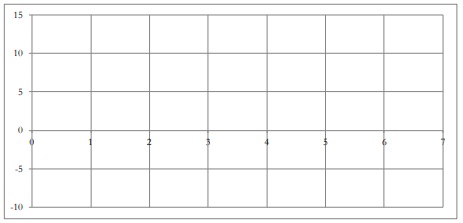
c. Fill out the following table, finding the profit gap between locating in clusters of more than one entrepreneur compared to locating to an isolated site (i.e., a cluster of size 1). That is, how much more profit will the firm earn in a cluster of multiple entrepreneurs compared to working in an isolated site (i.e., a cluster of size 1)?
Then graph the profit graph on the given below.
|
Number of entrepreneurs
|
1
|
2
|
3
|
4
|
5
|
6
|
7
|
|
Profit gap
|
(0)
|
|
|
|
|
|
|
d. What would we expect the equilibrium cluster size to be? No explanation needed (yet).
e. Briefly explain why the equilibrium cluster size wouldn't be smaller than your answer in part (d).
f. Briefly explain why the equilibrium cluster size wouldn't be larger than your answer in part (d).
4. Rank (But Not the Album by The Smiths) Assume that the rank-size rule for cities is exactly true and that the second-largest city in a region has 8 million people.
a. How many people live in the region's largest city? Show your work
b. How many people live in the region's fourth-largest city? Show your work.
c. How many people live in the region's tenth-largest city? Show your work.