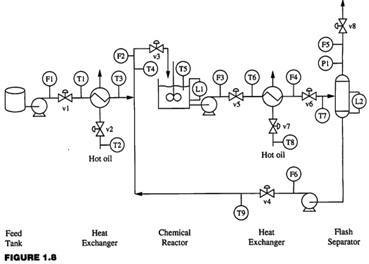
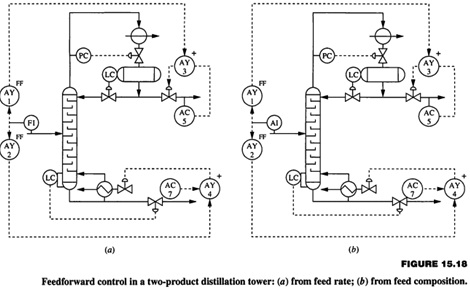
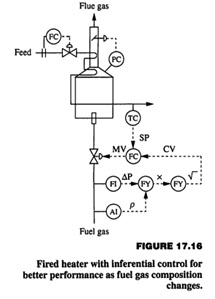
Problem 1: For each of the following processes, identify at least one control objective in each of the seven categories introduced. Describe a feedback approach appropriate for achieving each objective.
(a) The reactor-separator system in Figure

(b) The boiler in Figure
(c) The distillation column in Figure
(d) The Fired heater in Figure
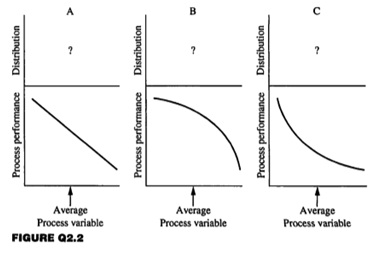
Problem 2: The best distribution of variable values depends strongly on the performance function of the process. Three different performance functions are given in Figure Q2.2. In each case, the average value of the variable (xave) must remain at the specified value, although the distribution around the average is not specified. The performance function, P, can be assumed to be a quadratic function of the variable, x, in every segment of the distribution.
Pi = a + b (xi -xave) + c (xi - xave)2
For each of the cases in Figure below, discuss the relationship between the distribution and the average profit, and determine the distribution that will maximize the average performance function. Provide quantitative justification for your result.
Problem 3: The Fired heater example in Figure above had a hard constraint. (a) Sketch the performance function for this situation, including the performance when violations occur, on the figure. (b) Assume that the distribution of the temperature would have 0.005 fraction of its operation exceeding the limit of 864°C and that each time the limit is exceeded, the plant incurs a cost of $1,000 to restart the equipment. Can you calculate the total cost per year for exceeding the limit? (c) Make any additional assumptions and complete the calculation.
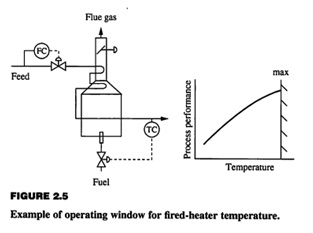
Problem 4: Sometimes there is no active hard constraint. Assume that the ?Fired heater in Figure 2.11 has no hard constraint, but that a side reaction forming undesiFired products begins to occur significantly at 850°C. This side reaction has activation energy with larger magnitude than the product reaction. Sketch the shape of the performance function for this situation. How would you determine the best desiFired (average) value of the temperature and the best temperature distribution?
Problem 5: Sometimes engineers use a shortcut method for determining the average process performance. In this shortcut, the average variable value is used, rather than the full distribution, in calculating the performance. Discuss the assumptions implicit in this shortcut and when it is and is not appropriate.
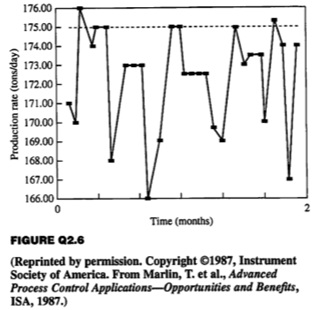
Problem 6: A chemical plant produces vinyl chloride monomer for subsequent production of polyvinyl chloride. This plant can sell all monomer it can produce within quality specifications. Analysis indicates that the plant can produce 175 tons/day of monomer with perfect operation. A two-month production record is given in Figure. Calculate the profit lost by not operating at the highest value possible. Discuss why the plant production might not always be at the highest possible value.
Problem 7: A blending process, shown in Figure, mixes component A into a stream. The objective is to maximize the amount of A in the stream without exceeding the upper limit of the concentration of A, which is 2.2 mole/m3. The current operation is "open-loop," with the operator occasionally looking at the analyzer value and changing the flow of A. The flow during the period that the data was collected was essentially constant at 1053 m3/h. How much more A could have been blended into the stream with perfect control, that is, if the concentration of A had been maintained exactly at its maximum? What would be the improvement if the new distribution were normal with a standard deviation of 0.075 mole/m3?
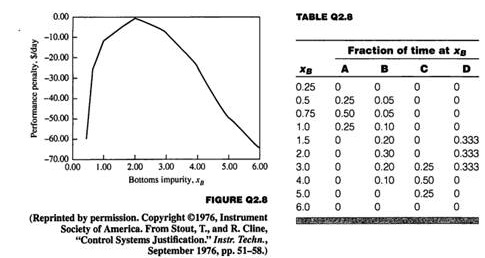
Problem 8: The performance function for a distillation tower is given in Figure in terms of lost profit from the best operation as a function of the bottoms impurity, *B (Stout and Cline, 1978). Calculate the average performance for the four distributions (A through D) given in Table along with the average and standard deviation of the concentration, x&. Discuss the relationship between the distributions and the average performance.
Problem 9: Profit contours similar to those in Figure have been reported by Gorzinski (1983) for a distillation tower separating normal butane and isobutane in an alkylation process for a petroleum refinery. Based on the shape of the profit contours, discuss the selection of desiFired values for the distillate and bottoms impurity variables to be used in an automation strategy. (Recall that some variation about the desiFired values is inevitable.) If only one product purity can be controlled tightly to its desiFired value, which would be the one you would select to control tightly?
Grab the chance to score A++ by availing Temperature Distribution Assignment Help, Homework Help service today.
Tags: Temperature Distribution Assignment Help, Temperature Distribution Homework Help, Temperature Distribution Coursework, Temperature Distribution Solved Assignments, Automation Strategy Assignment Help, Automation Strategy Homework Help, Plant Production Assignment Help, Plant Production Homework Help, Performance Function Assignment Help, Performance Function Homework Help