Response to the following problem:
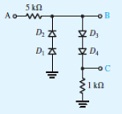
In the circuit shown in Figure, the diodes exhibit a 0.7-V drop at 0.1 mA. For inputs over the range of ±5 V, use the diode exponential model to provide a calibrated sketch of the voltages at outputs B and C versus vA. For a 5-V peak 100-Hz sinusoid applied at A, sketch the signals at nodes B and C.