Response to the following:
In the setting of Example 1, draw the likelihood surface associated with the model when the sample of size 400 is produced by
> x=rnorm(80,mean=-4)
> for (i in 1: 4) x=C(x,rnorm(80,mean=-4+2*i))
and determine the number of local maxima associated with a given sample.
Example 1:
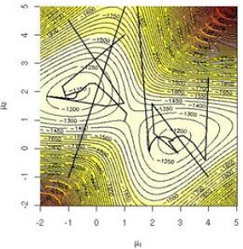
The likelihood associated with the mixture model
1/4 N (μ1,1)+3/4N(μ2,1)
is bimodal, as seen in Figure for a simulated sample of 400 observations from this mixture with μ1 = 0 and μ2 = 2.5, actually produced by
> da=rbind(rnorm(10ˆ2), 2.5+rnorm(3*10ˆ2))
> like=function(mu){
+ sum (log((.25*dnorm(da-mu[1]+.75*dnorm(da-mu[2]))))}
and by applying the R function contour to a grid of points where the loglikelihood function like is computed. When using nlm, the modes are obtained within a few iterations, depending on the starting points, and the intermediate values of the Newton-Raphson sequence can be plotted by
> sta=c(1,1)
> mmu=sta
> for (i in 1:(nlm(like,sta)$it))
+ mmu=rbind(mmu,nlm(like,sta,iter=i)$est)
> lines(mmu,pch=19,1wd=2)
where the function like has been redefined as its inverse to account for the fact that nlm produces a local minimum. Note that some starting points produce warnings:
NA/Inf replaced by maximum positive value in: nlm(like, sta)
meaning that the (numerical approximation to the) Hessian is not invertible at the current value. The sequences represented in Figure all end up in one of the two modes, but with highly nonlinear patterns. For instance, the starting point (- 1, -1) corresponds to a very steep gradient and thus bypasses the main mode (- 0.68, 1.98) to end up at the secondary one (lower in likelihood). Although all represented sequences do converge, starting farther away from the modes may produce divergent sequences.