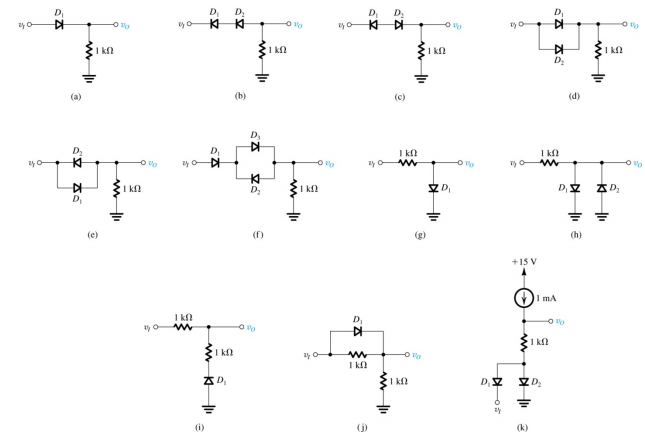
1- In each of the ideal-diode circuits shown in the figure below, v1 is a 1-KHz, 10-V peak sin wave. Sketch the waveform resulting at v0. What are the positive and negative peak values?
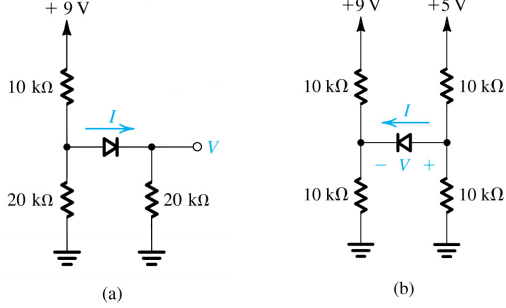
2- Assuming that the diodes in the circuits below are ideal, utilize Thévenin theorem to simplify the circuits and thus find the values for the labeled currents and voltages.
3- (D) For the rectifier circuits shown below, let the input sin wave have 120-V rms value and assume the diode to be ideal. Select a suitable value of R so that the peak diode current doesn't exceed 50 mA. What is the greatest reverse voltage that will appear across the diode?
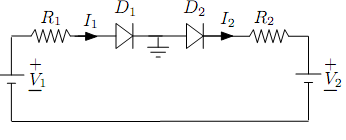
4- In the diode circuit shown below, R1 = 2kΩ, R2 = 1kΩ, V1 = 12V and V2 = 15V. Determine the diode currents I1 and I2. Assume that cut-in voltage for both diodes is VΥ = 0.7V.
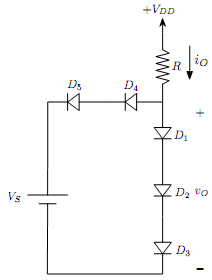
5- The diode circuit shown in the figure below has R = 30kΩ and VDD = 10V. Determine the current io and voltage vo if
a. vs = 5V
b. vs = 12V
You may assume that cut-in voltage for all diodes is VΥ = 0.7V.
6- Find the voltage vo and current io in the diode circuit shown below if R1 = 5kΩ, R2 =10kΩ, v1 = 5V and v2 = 10V. Assume that cut-in voltage for all diodes is VΥ = 0.7V.
