Solve the following problem:
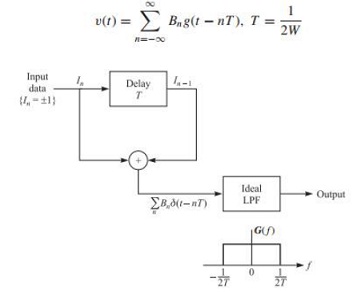
A PAM partial-response signal (PRS) is generated as shown in Figure by exciting an ideal lowpass filter of bandwidth W by the sequence
Bn = In + In-1
at a rate 1/T = 2W symbols/s. The sequence {In} consists of binary digits selected independently from the alphabet {1, -1} with equal probability. Hence, the filtered signal has the form
1. Sketch the signal space diagram for v(t), and determine the probability of occurrence of each symbol.
2. Determine the autocorrelation and power density spectrum of the three-level sequence {Bn}.
3. The signal points of the sequence {Bn} form a Markov chain. Sketch this Markov chain, and indicate the transition probabilities among the states.