Solve the following problem:
a. Sketch the response of the magnitude of Vo (in terms of Vi) versus frequency for the low-pass filter of Fig.
b. Using the results of part (a), sketch the response Av = Vo /Vi for the same frequency range.
c. Sketch the idealized Bode plot.
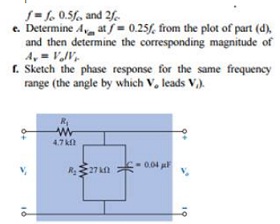
d. Sketch the actual response indicating the dB difference between the idealized and the actual response at