Discuss the below:
1. Determine if this is an example of probability or statistics: More than half of all men surveyed preferred to watch college football over college basketball.
2. Determine if this data is qualitative or quantitative: Gender
3. Determine if this study is experimental or observational: Tests were conducted on two types of AA batteries to compare the lifetimes of each.
4. Construct a grouped frequency distribution for the data given below:
233 219 224 220 226 231 232 226 221 220
230 232 224 220 223 229 222 226 229 232
5. Determine if this is an example of a variable or a parameter: The average salary of an actuary is $74,270.
6. Determine if this statistical study is descriptive or inferential:
A study establishes a link between underage drinking and suicide rate among teens.
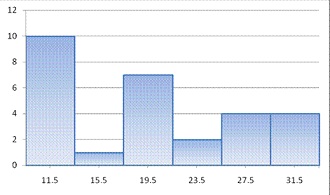
7. Given the class midpoints in the histogram below, create the corresponding grouped frequency distribution:

8. Identify the sampling technique used to obtain this sample: A man who is lost asks the first three people he encounters on a sidewalk for directions.
9. In your own line of work, give one example of a discrete and one example of a continuous random variable, and describe why each is continuous or discrete.