The design team for an aircraft used stochastic PERT and simulation to develop their bid and assess risk. Use the simplified PERT diagram below and the Excel add-in Crystal Ball to develop a plot of probability versus completion time to illustrate making the Jan 2006 roll-out date.
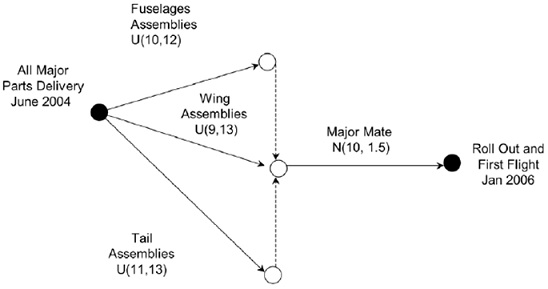
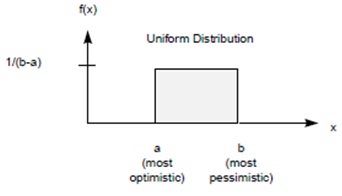
Note that a U (10. 12) denotes a uniform distribution varying between 10 and 12 months as shown below:
A N(10, 15) denotes a normal distribution with a mean of 10 and a standard deviation of 1.5 months.