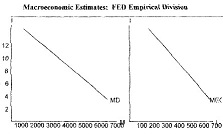
Describe the current equilibrium level of disposable national Income using a Keynesian Cross Diagram.
Monetary Data (Private Banking Industry)
| Cash |
1,000 |
| Checking Accounts |
2,500 |
| Short Term Savings Accounts |
1,500 |
| Required Reserves |
1,000 |
| Excess Reserves |
0,000 |
| US Government Securities |
10,000 |
Monetary Data (FED)
| Discount Rate |
6.00% |
| Us Government Securities |
100, 000 |
Macroeconomic Data
C= 1000+0.75(YD); G=1,000; YF=9,000

Part 1: Determine the current equilibrium level; of disposable national Income. Be sure to use a Keynesian Cross Diagram to illustrate your answer.
Part2: Asses the current state of macroeconomics affairs.
Part3: Design a detailed monetary policy to attain your objectives.
Part4: Clearly illustrate your policy. Describe the chain of events leading to the new macroeconomics equilibrium. Pay attention to detail of implementation.