Make use of the graph below to answer the questions illustrated below:
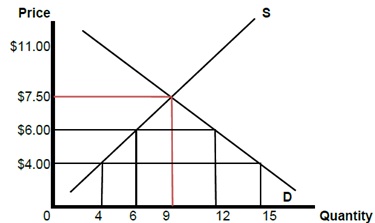
The graph above shows the demand and supply of socks for the country of Bangladesh.
1. If trade is avoided, Bangladesh consumes _____ pairs of socks at a price of _____ per socks.
2. With free trade, for a world price of $4 per pair of socks, Bangladesh is producing _____pairs of socks.
3. With free trade, for a world price of $4 per pair of socks, Bangladesh is consuming _______ pairs of socks.
4. With free trade, for a world price of $4 per pair of socks, Bangladesh is importing _________pairs of socks.
5. If the world price is $4 per sock, and the government of Bangladesh imposes a tariff of $1, Bangladesh produces ____________ and imports __________pairs of socks.
6. If the world price is $4 per pair of socks, and the government of Bangladesh imposes a tariff of $1, how much tariff revenue will the Bangladesh government collect? _____ .