Solve the problem:
Statistical Calculations
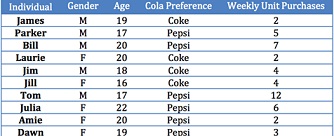
1. Use the data in the table below to
1. Prepare a frequency distribution of the respondents' ages
2. Cross-tabulate the respondents' genders with cola preference
3. Identify any outliers

2. Data on the average size of soda (in ounces) at all 30 major league baseball parks are as follows: 14, 18, 20, 16, 16, 12, 14, 16, 14, 16, 16, 16, 14, 32, 16, 20, 12, 16, 20, 12, 16, 16, 24, 16, 16, 14, 14, 12, 14, 20. Compare descriptive statistics for this variable including a box and whisker plot. Comment on the results.
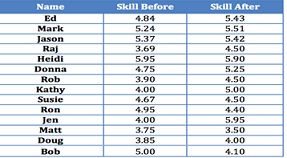
3. A sales force received some management-by-objectives training. Are the before/after mean scores for salespeople's job performance statistically significant at the 0.05 level? The results from a sample of employees are as follows

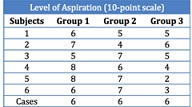
4. In an experiment with wholesalers, a researcher manipulated perception of task difficulty and measured level of aspiration for performing the task a second time. Group 1 was told the task was very difficult, group 2 was told the task was somewhat difficult but attainable, and group 3 was told the task was easy. Perform an ANOVA of the resulting data

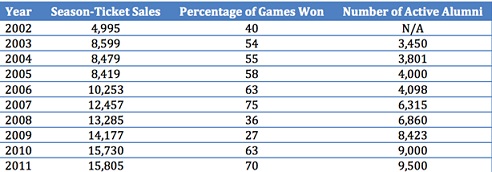
5. The table below gives a basketball team's season-ticket sales, percentage of games won, and number of active alumni for the years 2002-2011
1. Compute a correlation matrix for the variables. A software statistical package is recommended. Interpret the correlation between each pair of variables
2. Estimate a regression model for sales = percentage of games won
3. Estimate a regression model for sales = number of active alumni
4. If sales is the dependent variable, which of the two independent variables do you think explains sales better? Explain.
