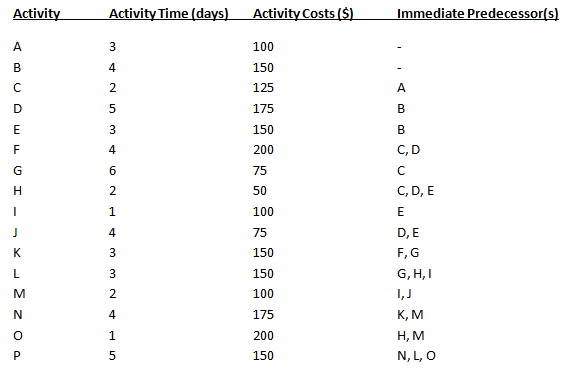
Question 1: The information in the table shown below is available for a large fund-raising project.
a) Find out the critical path and the expected completion time of the project.
b) Plot the total project cost, starting from day 1 to the expected completion date of the project, supposing the earliest start times for each activity. Compare that result to a similar plot for the latest start times. What implication does the time differential have for the cash flows and project scheduling?
