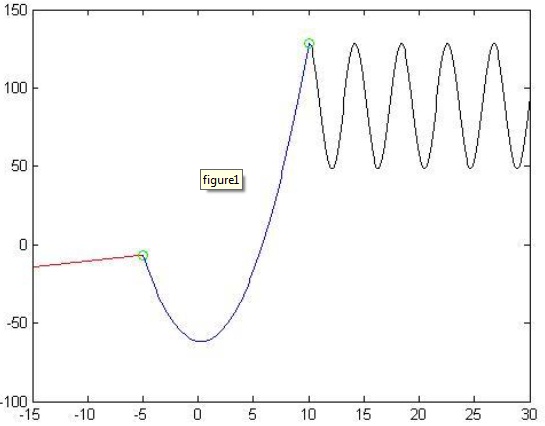
For this assignment, you will need create four separate MatLab user-defined functions called “cs151sp13assn6first.m”, “cs151sp13assn6point.m”, “cs151sp13assn6second.m”, and “cs151sp13assn6cos.m”. Your functions will permit you to create the following graph, which contains a piecewise function where line exists in the first interval, a parabola in the second interval, and the sine function in the third interval. Notice that where each interval meets, points with an ‘o’ marker are located. Each one of the 4 functions you create will plot something on a single figure.
Create four functions based on the following instructions:
cs151sp13assn6first
Create a function called cs151f11assn5first. The aim of this function is to plot the line of the first interval. This function has four input arguments (in this order):
• the x and y coordinates of a point on line (matrix of two values: x and y)
• the x and y coordinates of a point the line (matrix of two values: x and y)
• a scalar of the beginning of the interval of the x-domain on the figure
• a scalar of the end of the interval of the x-domain on the figure
This function doesn’t return any values, meaning it has no output arguments. This function would first compute the slope of the line using the two points. To do this, compute the change in y divided by the change in x, aka the rise over run equation. You would also require to find the y intercept. To perform this, use the x and y values of one of the points and solve for b in the equation y = mx +b (remember, m is the slope you just computed). A vector of x-values will need to be created using the beginning and ending values of interval of the x-domain, with an increment of 0.1. Then, create the y-values using the equation y= mx + b . Finally, plot the line in red.
cs151sp13assn6second
This function, called cs151f11assn5second, will plot the parabola within its x-domain interval and will not return a value. This function needs three input arguments (in this order):
• the vector of a, b, and c, which will be used in the parabolic equation y = ax + bx2 + c
• a value of the beginning of the x-domain interval of the parabola
• a value of the ending of the x-domain interval of the parabola
Just like in the previous function, a vector of x-domain values needs to be created with an increment of 0.1, and be used to help plot your parabola, colored in blue.
cs151sp13assn6cos
There would be six input arguments for this function, and would also return a matrix. The first four input arguments will be in this order: the amplitude (amp), frequency (freq), horizontal shift (hs) and the vertical shift (vs) of the sine function. The last two input arguments would be the interval of the x-domain of the sine function on the graph. Again, the values of the x-domain must run from the beginning of the interval to the end of the interval using an increment of 0.1. Function would return a matrix which contains the x and y coordinates of the beginning point of the interval. The function will require to graph the equation y =vs+ amp(cos( freq(x - hs))) in black.
cs151sp13assn6point
This function has two input arguments which represent the x and y coordinates of a point. This function doesn’t return any values, but would only plot a single point using an ‘o’ that is colored in green.