Discuss the below:
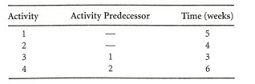
Q1: Construct a Gantt chart for the following set of activities and indicate the project completion time:
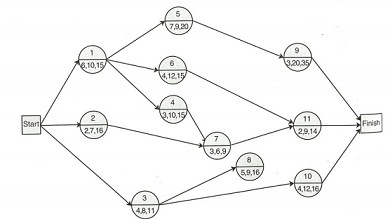
Q2: Given the following network and activity time estimates, determine the expected time and variance for each activity and indicate the critical path: