Discuss the below:
1. A survey on 25 people on how they got news resulted in the following data.
M M N M R
N N R T T
R N T M R
R M T N M
R N R N T
a) Construct a frequency distribution for the data (N = newspaper, T = television, R = radio, M = Magazine)
b) Construct a pie graph for the data and analyze the results.
2. Below are the grades of 50 students on a marketing test.
73 65 82 70 45 50 70 54 75 32
67 75 65 60 75 87 83 40 72 64
58 75 89 70 73 55 61 78 93 89
51 43 59 38 65 71 75 85 65 85
49 97 55 60 76 75 35 63 69 45
a) Construct a frequency distribution for the above data.
b) Construct a histogram for the data
c) Construct a frequency polygon for the data
d) Construct a stem and leaf display of the data.
3. Find the a) mean, b) median, c) mode, and d) midrange, for the given set of data.
17 11 15 17 12 22 15 10
4. When a sample consists of a random selection of groups of units, the sample is said to be a ____________ sample.
a) cluster b) biased c) stratified d) systematic e) random
5. In a circle graph a frequency of 126 out of a total of 1512 is to be represented. How large should the central angle for this sector be?
a) 15° b) 30° c) 60 ° d) 45° e) 36°
6. Samantha's mean average on eight exams is 91. Find the sum of her scores.
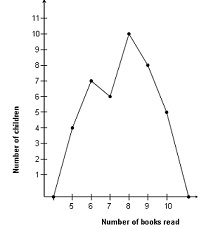
7. Use the frequency polygon below to answer the following questions
Number of Books Read in One Month

a) How many children read 9 books in one month?
b) How many children were surveyed?