Discuss the below:
Q1. Calculating z scores. The reaction time to a stimulus for a certain test has a mean of 2.5 seconds and a standard deviation of 0.3 second.
a. X = 2.7
b. X = 3.9
c. X = 2.8
d. X = 3.1
e. X = 2.2
|
Weights
|
Frequency
|
|
52.5-55.85
55.5-58.5
58.5-61.5
61.5-64.5
64.5-67.5
|
9
12
17
22
15
|
Q2. The distribution represents the data for weights of fifth grade boys. Find the approximate weighs corresponding to each percentile given by constructing a percentile graph. Explain how you calculated each answer.
a. 25th percentile.
b. 60th percentile.
c. 80th percentile.
d. 95th percentile.
3. Check each data set for outliers
a. 16, 18, 22, 19, 3, 21, 17, 20
b. 24, 32, 54, 31, 16, 18, 19, 14, 17, 20
c. 321, 343, 350, 327, 200
d. 88, 72, 97, 84, 86, 85, 100
e. 145, 119, 122, 118, 125, 116
f. 14, 16, 27, 18, 13, 19, 36, 15, 20
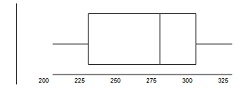
Q4. Identify the following numbers on the boxplot.
200 225 250 275 300 325
a. Minimum Value:
b. Median:
c. First Quartile:
d. Third Quartile:
e. Interquartile Rrange:
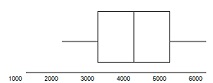
Q5. Identify the following numbers on the boxplot.
1000 2000 3000 4000 5000 6000
a. Maximum Value:
b. Minimum Value:
c. Median
d. First Quartile
e. Third Quartile:
f. Interquartile Range:
Q6. Shown is the number of new theater productions that appeared on Broadway for the past several years. Construct a boxplot for the data and comment on the shape of the distribution
30 28 33 29 37 39
35 37 37 38 34