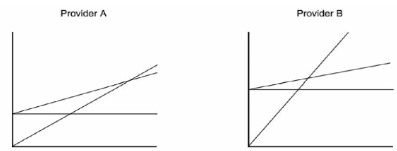
1. Consider the CVP graphs below for two providers operating in a fee-for-service environment:
a. Assuming the graphs are drawn to the same scale, which provider has the greater fixed costs? The greater variable cost rate? The greater per unit revenue?
b. Which provider has the greater contribution margin?
c. Which provider needs the higher volume to break even?
d. How would the graphs change if the providers were operating in a discounted fee-for- service environment? In a capitalized environment?

2. Assume that a radiologist group practice has the following cost structure:
Fixed Costs: $500,000
Variable Cost per procedure: $25
Charge (revenue) per procedure: $100
Furthermore, assume that the group expects to perform 7,500 procedures in the coming year.
- Construct the group's base case projected P&L statement.
- What is the group's contribution margin? What is its breakeven point?
- What volume is required to provide a pretax profit of $100,000? A pretax profit of $200,000?
- Sketch out a CVP analysis graph depicting the base case situation. Now assume that the practice contracts with one HMO, and the plan proposes a 20 percent discount from charges. Redo questions a, b, c, and d under these conditions.
3. General Hospital, a not-for-profit acute care facility, has the following cost structure for its inpatient services:
Fixed Costs: $10,000,000
Variable cost per inpatient day: $200
Charge (revenue) per inpatient day: $1,000
The hospital expects to have a patient load of 15,000 inpatient days next year.
- Construct the hospital's base case projected P&L statement.
- What is the hospital's breakeven point?
- What volume is required to provide a profit of $1,000,000? A profit of $500,000?
- Now assume that 20 percent of the hospital's inpatient days come from a managed care plan that wants a 25 percent discount from charges. Should the hospital agree to the discounted proposal?
4. You are considering starting a walk-in clinic. Your financial projections for the first year of operations are as follows:
Revenues: $400,000
Wages & Benefits: $220,000
Rent: $5,000
Depreciation: $30,000
Utilities: $2,500
Medical Supplies: $50,000
Administrative Supplies: $10,000
Assume that all costs are fixed, except supply costs, which are variable. Furthermore, assume that the clinic must pay taxes at a 20 percent rate.
- Construct the clinic's projected P&L statement.
- What number of visits is required to break even?
- What number of visits is required to provide you with an after-tax profit of $100,000?
5. The housekeeping services department of Ruger Clinic, a multi-specialty practice in Toledo, Ohio had $100,000 in direct costs during 2011. These costs must be allocated to Ruger's three revenue-producing patient services departments using the direct method. Two cost drivers are under consideration: patient services revenue and hours of housekeeping services used. The patient services departments generated $5 million in total revenues during 2011, and to support these clinical activities, they used 5,000 hours of housekeeping services.
- What is the value of the cost pool?
- What is the allocation rate if:
- Patient services revenue is used as the cost driver?
- House of housekeeping services is used as the cost driver?
6. Refer to Problem 6.1. Assume that the three patient services departments are adult services, pediatric services, and other services. The patients services revenue and house of housekeeping services for departments are:
|
Department
|
Revenue
|
Housekeeping Hours
|
|
Adult Services
|
3,000,000
|
1500
|
|
Pediatric Services
|
1,500,000
|
3000
|
|
Other Services
|
500,000
|
500
|
|
Total
|
5,000,000
|
5000
|
- What is the dollar allocation to each patient services department if patient services revenue is used as the cost driver?
- What is the dollar allocation to each patient services department if hours of housekeeping support are used as the cost driver?
- What is the difference in the allocation to each department between the two drivers?
- Which of the two drivers is better? Why?
7. St. Benedict's Hospital has three support departments and four patients services departments. The direct costs to each of the support departments are:
General Admin: $2,000,000
Facilities: $5,000,000
Financial Services: $3,000,000
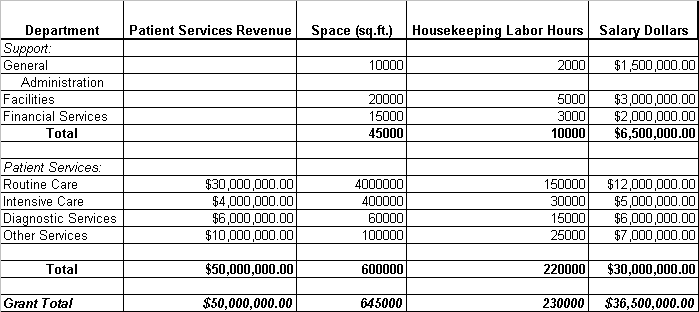
Selected data for the three support and four patient services department are:

Assume that the hospital uses the direct method for cost allocation. Furthermore, the cost driver for general administration and financial services patient services revenue, while the cost driver for facilities is space utilization.
- What are the appropriate allocation rates?
- Use a allocation table similar to Exhibit 6.7 (below) to allocate the hospital's overhead costs to the patient services departments.

Exhibit 6.7
8. Assume that the hospital uses salary dollars as the cost driver for general administration, housekeeping labor hours as the cost driver for facilities, and patient services revenue as the cost driver for financial services. (The majority of the costs of the facilities department stem from the provision of housekeeping services.)
- What are the appropriate allocation rates?
- Use an allocation table similar to the one used for Problem 6.3 to allocate the hospital's overhead costs to the patient services departments.
- Compare the dollar allocations with those obtained in Problem 6.3. Explain the differences.
- Which of the two cost driver schemes is better? Explain.