Assignment:
The Facts:
Each year, the National Highway Traffic Safety Administration (NHTSA) with the National Center for Statistics and Analysis (NCSA) publishes Traffic Safety Facts, which summarizes the motor vehicle traffic crashes for the United States. Traffic Safety Facts 2005 includes trend data, crash data, vehicle data, and people data. Also, the NHTSA and NCSA publish a report summarizing the motor vehicle crash data of the 32 states in the NHTSA's State Data System.
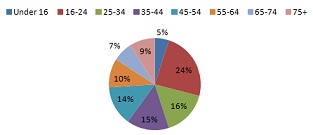
In 2005 there were 43,443 fatalities in the United States as a result of motor vehicle crashes. The pie chart at the right shows the national distribution of traffic fatalities with respect to age group. For example, 16% of all motor vehicle fatalities were adults age 25-34. Using the data from the 32 states in the NHTSA's State Data System as a sample, the contingency table shows the number of motor vehicle fatalities according to the age and geographic location within the United States.
|
Age
|
Eastern US
|
Central US
|
Western US
|
|
Under 16
|
651
|
841
|
414
|
|
16-24
|
3309
|
3478
|
1655
|
|
25-34
|
2255
|
2346
|
1154
|
|
35-44
|
2132
|
2163
|
1021
|
|
45-54
|
1977
|
1994
|
955
|
|
55-64
|
1359
|
1361
|
668
|
|
65-74
|
941
|
939
|
386
|
|
75+
|
1354
|
1190
|
498
|
1. At alpha=0.05, perform a chi-square independence test to determine whether the variables region and age are independent. What can you conclude?
2. Compare the distribution of the sample of motor vehicle fatalities from the eastern United States with the National distribution. What can you conclude?
3. Compare the distribution of the sample of motor vehicle fatalities from the United States with the national distribution. What can you conclude?
4. Compare the distribution of the sample of motor vehicle fatalities from the western United States with the national distribution. What can you conclude?
US Distribution of Traffic Fatalities
