Statistical Process Control
You own and operate a restaurant and you decided to track meal temperatures using statistical process control.
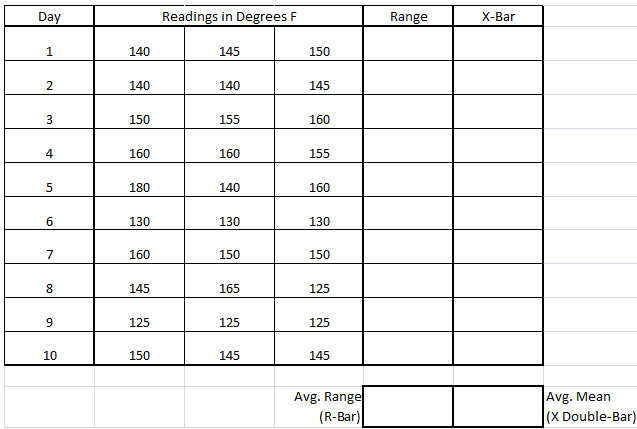
Given:
Complete this data table:
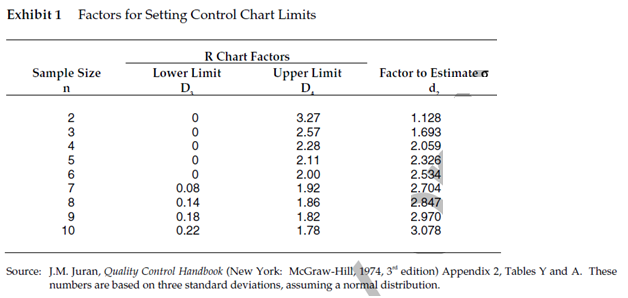
Calculate the Range Chart Limits and the X-Bar Chart Limits (LCL, UCL, Center)
And
Draw your X-Bar and R Charts and describe what the data is telling you?