Problem 1. How can we measure the opportunity cost of leisure? Why is the supply curve for labor usually upward sloping?
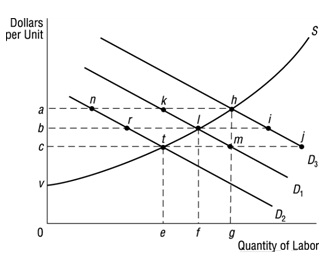
Problem 2. In the graph below, assume that the market demand curve for labor is initially D1. Answer the following questions.

a. What are the equilibrium wage rate and employment level?
b. What area represents economic rent?
c. Assume that the price of a substitute resource decreases, other things constant. What happens to demand for labor?
What are the new equilibrium wage rate and employment level? What happens to economic rent?
d. Suppose instead that demand for the final product increases, other things constant. Using labor demand curve D1 as your starting point, what happens to the demand for labor?
What are the new equilibrium wage rate and employment level?
What happens to economic rent?
Problem 3: Use the following data to answer the questions below. Assume a perfectly competitive product market.
Units Of Labor Units of Output
0 0
1 8
2 12
3 17
4 21
5 23
a. Calculate the marginal revenue product at each level of labor input if output sells for $4 per unit.
b. If the wage rate is $15 per hour, how much labor will be hired?
c. What is the firm's total revenue and total amount paid for labor at the level of labor input you determined in (b)?