Assignment:
1. In the late eighteenth century, the price of bread in New York City was controlled, set at a predetermined price above the market price.
a) Draw a diagram showing the effect of the policy. Did the policy act as a price ceiling or a price floor?
b) What kinds of inefficiencies were likely to have arisen when the controlled price of bread was above the market price? Explain in detail.
One year during this period, a poor wheat harvest caused a leftward shift in the supply of bread and therefore an increase in its market price. New York bakers found that the controlled price of bread in New York was below the market price.
c) Draw a diagram showing the effect of the price control on the market for bread during this one - year period. Did the policy act as a price ceiling or a price floor?
d) What kinds of inefficiencies do you think occurred during this period? Explain in detail.
2. For the last 70 years the U.S. government has used price supports to provide income assistance to American farmers. To implement these price supports, at times the government has used price floors, which it maintains by buying up the surplus farm products. At other times, it has used target prices, a policy by which the government gives the farmer an amount equal to the difference between the market price and the target price for each unit sold. Consider the market for corn depicted in the accompanying diagram.
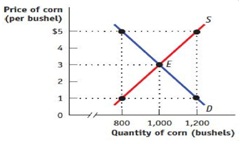
a) If the government sets a price floor of $5 per bushel, how many bushels of corn are produced? How many are purchased by consumers? By the government? How much does the program cost the government? How much revenue do corn farmers receive?
b) Suppose the government sets a target price of $5 per bushel for any quantity supplied up to 1,000 bushels. How many bushels of corn are purchased by consumers and at what price? By the government? How much does the program cost the government? How much revenue do corn farmers receive?
c) Which of these programs (in parts a and b) costs corn consumers more? Which program costs the government more? Explain.
d) Is one of these policies less inefficient than the other? Explain.
3. The accompanying table shows the price and yearly quantity sold of souvenir T-shirts in the town of Crystal Lake according to the average income of the tourists visiting.
|
Price of T-shirt
|
Quantity of T-shirt demanded of when average tourist income is $20,000
|
Quantity of T-shirts demanded when average tourist income is $30,000
|
|
$4
|
3,000
|
5,000
|
|
5
|
2,400
|
4,200
|
|
6
|
1,600
|
3,000
|
|
7
|
800
|
1,800
|
a) Using the midpoint method, calculate the price elasticity of demand when the price of a T-shirt rises from $5 to $6 and the average tourist income is $20,000. Also calculate it when the average tourist income is $30,000.
b) Using the midpoint method, calculate the income elasticity of demand when the price of a T-shirt is $4 and the average tourist income increases from $20,000
4. The price elasticity of supply for plastic bags is 0.5 at the current price of $10 per plastic bag and the current consumption level of 4000,000 plastic bags.
Calculate the change in the quantity supplied when price rises by $1.
5. A theatre is experiencing a decline in the number of tickets sold and thus a decline in revenues. The price of an entrance ticket is $20 and on average, 2,500 tickets are sold on a daily basis. Currently, the price elasticity of demand is estimated to be 1.5 and each the rooms are currently operating at an average of 75 percent of capacity. Which of the following strategy will help to increase the theater's revenues and profits.
a) a 10% increase in the price of a ticket.
b) an advertisement as a marketing strategy
c) A combination of both strategies a and b.
d) a 10% decrease in the price of a ticket.