Assignment:
1. The number of homicides in 5 Canadian provinces for 1997 and 2001 are as follows
1997 2001
Province Homicides Population Homicides Population
Nova Scotia 24 906,100 9 942,900
Quebec 132 7,323,600 149 7,417,700
Ontario 178 11,387,400 170 12,068,300
Manitoba 31 1,137,900 34 1,150,800
British Colombia 116 3,997,100 85 4,141,300
a) Calculate the homicide rate per 100,000 population for each province for each year. Relatively speaking, which province had the highest homicide rates in each year? Which society seems to have the higher homicide rate Write a paragraph describing these results.
b)Using the rates you calculated in part a Calculate the percentage change between 1997 and 2001 for each province. Which province had the largest increase and decrease? Which society seems to have the largest change in homicide rates? Summarize your results in a paragraph.
2. Following are reported the number of times 25 residents of a community for senior residents left their homes for any reason during the past week
0 2 1 7 3
7 0 2 3 17
14 15 5 0 7
5 21 4 7 6
2 0 10 5 7
a) Construct a frequency distribution to display these data
b) What are the midpoints of the class intervals?
c) Add columns to the tables to display the percentage distribution, cumulative frequency and cumulative percentages
d) Find the real limits for the intervals you selected
e) Construct a histogram and a frequency polygon to display this distribution
f) Write a paragraph summarizing this distribution of scores
3. The data below represent the percentage of workers living in each city who used public transportation for work in 2000
City Percent
Baltimore 20
Boston 32
Chicago 26
Dallas 6
Detroit 9
Huston 6
Los Ang 10
Miami 11
Minneap 15
New Orlean 14
New York 53
Philadelphia 25
Phoenix 3
San Antonio 4
San Diego 4
San Francisco 31
Seattle 18
Washington DC 33
a) Calculate the mean and median of this distribution
b) Compare the mean and median Which is higher? Why?
c) If you remove New York from the distribution and recalculate what would happen to the mean? Median? Why?
4. A research study of manual dexterity involved determining the time required to complete a task. The time required for each of 40 disabled individuals is as follows (data are ranked):
|
7.1
|
7.2
|
7.2
|
7.6
|
7.6
|
7.9
|
8.1
|
8.1
|
8.1
|
8.3
|
|
8.3
|
8.4
|
8.4
|
8.9
|
9.0
|
9.0
|
9.1
|
9.1
|
9.1
|
9.1
|
|
9.4
|
9.6
|
9.9
|
10.1
|
10.1
|
10.1
|
10.2
|
10.3
|
10.5
|
10.7
|
|
11.0
|
11.1
|
11.2
|
11.2
|
11.2
|
12.0
|
13.6
|
14.7
|
14.9
|
15.5
|
Find: a. Q1 b. Q2 c. Q3 d. P95
e. the 5-number summary f. Draw the box-and-whisker display.
5. Data on several variables measuring overall health and wellbeing for 10 nations are reported below for 2000 with projections to 2010. Are these nations becoming more or less diverse on these variables? Calculate the mean, range, and standard deviation for each year for each variable. Summarize the results in a paragraph.
Life Expectancy
(Years)
2000 2010
Canada 80 81
USA 77 79
Mexico 72 74
Colombia 71 73
Japan 80 82
China 72 74
Sudan 57 61
Kenya 48 44
Italy 79 80
Germany 78 79
6. A group of 15 people were given a test to assess their computer skills. The test scores ranged from 0 to 24, 24 meaning the best ability to use computer programs. Then a course was given to these people on several computer programs, and their ability to use the programs was reassessed after the course. The results of the test of skills before and after the program are presented below:
|
Pretest
|
|
|
Post-test
|
|
|
Scores
|
f
|
|
Scores
|
f
|
|
0-- 4
|
2
|
|
0-4
|
0
|
|
5--9
|
4
|
|
5-9
|
3
|
|
10--14
|
7
|
|
10-14
|
7
|
|
15--19
|
2
|
|
15-19
|
3
|
|
20--24
|
0
|
|
20-24
|
2
|
|
Total
|
15
|
|
Total
|
15
|
Has the program helped to improve the computer skills? Calculate and compare the means and standard deviations of scores before and after the program to support your conclusion.
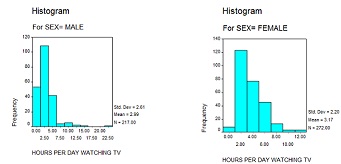
7. You are doing a research on the patterns of TV watching among Americans. One of your research questions looks into the differences in TV watching between females and males. The SPSS analysis of the General Social Survey in 2002 gives the following results:


Response the following questions as you would in a research report.
a. How many respondents among males and females indicated their TV watching on the survey?
b. Can we say that males watch more TV per day than the females? In your answer, compare the measures of central tendency for the two groups, the spread of the distributions and their shape.