Question 1: For the graph below:
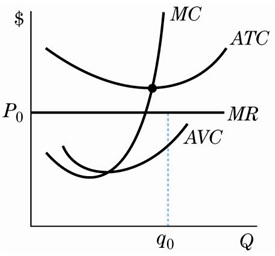
a. Does q0 represent the profit maximizing level of output? Yes or No. Explain.
b. Is the firm making a profit or realizing losses? How do you know?
c. Should the firm continue to operate in the short run? Explain
Question 2. The top four firms in industry A have market shares of 30, 25, 10 and 5% respectively. The top four firms in industry B have market shares of 15, 12, 8 and 4 % respectively.
Calculate the four firm concentration ratios for the two industries. Which industry is more concentrated?