Assignment:
Problems:
This problem set is designed to help you review the essential material. It covers many of the key concepts and economic tools discussed in these chapters.
Part 1: Consumer and Producer Surplus
1. a. Complete the table below, by adding each person's consumer surplus corresponding with both prices (i.e. Price 1 and Price 2)-- along with the change in consumer surplus for each person when the price increases from $5 to $9. This is a hypothetical 5 person economy for basketballs where each person is considering buying a single basketball.
|
Consumer
|
Willingness to Pay ($)
|
Price 1 ($)
|
Consumer Surplus 1 ($)
|
Price 2 ($)
|
Consumer Surplus 2 ($)
|
Change in Consumer Surplus when Price increases from Price 1 to Price 2 ($)
|
|
Scottie
|
15
|
5
|
|
9
|
|
|
|
Yolanda
|
12
|
5
|
|
9
|
|
|
|
Michael
|
8
|
5
|
|
9
|
|
|
|
Cappie
|
6
|
5
|
|
9
|
|
|
|
Dennis
|
4
|
5
|
|
9
|
|
|
b. What's the Total Consumer Surplus at Price 1? What's the Total Consumer Surplus at Price 2?
c. When the price increased from $5 to $9, consumer surplus (increased, decreased). Based upon this, we can also conclude that if the price went from $9 to $5, consumer surplus would (increase, decrease).
d. The people most affected by the policy are those (never bought the good, always bought the good). The people least affected by the policy are those who (never bought the basketball, always bought the basketball).
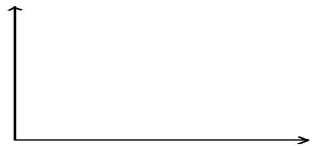
e. Draw the demand curve for this 5 person economy. Then, set the price equal to 9, and "shade in" or clearly indicate the area of the Consumer Surplus using your graph.

2 a. Complete the table below, by adding in each business's producer surplus corresponding with both prices (i.e. Price 1 and Price 2)-- along with the change in producer surplus for each business when the price increases from $5 to $9. This is a hypothetical 5 business economy for basketballs where each business is considering selling a single basketball.
|
Producer
|
Cost ($)
|
Price 1 ($)
|
Producer Surplus 1 ($)
|
Price 2 ($)
|
Producer Surplus 2 ($)
|
Change in Producer Surplus when Price increases from Price 1 to Price 2 ($)
|
|
Marquette's
|
2
|
5
|
|
9
|
|
|
|
Jackson's
|
4
|
5
|
|
9
|
|
|
|
Margaret's
|
6
|
5
|
|
9
|
|
|
|
Horner's
|
8
|
5
|
|
9
|
|
|
|
Washington's
|
10
|
5
|
|
9
|
|
|
b. What's the Total Producer Surplus at Price 1? What's the Total Producer Surplus at Price 2?
c. When the price increased from $5 to $9, total producer surplus (increased, decreased). Based upon this, we can also conclude that if the price went from $9 to $5, total producer surplus would (increase, decrease).
d. The people most affected by the policy are those (never sold the good, always sold the good). The people least affected by the policy are those who (never sold the good, always sold the good).
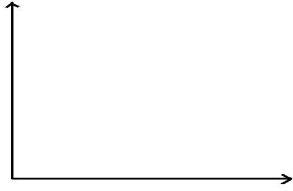
e. Draw the supply curve for this 5 business economy. Set the price equal to 9 and "shade in" or clearly indicate the area of the producer surplus.

Part II: Price Controls
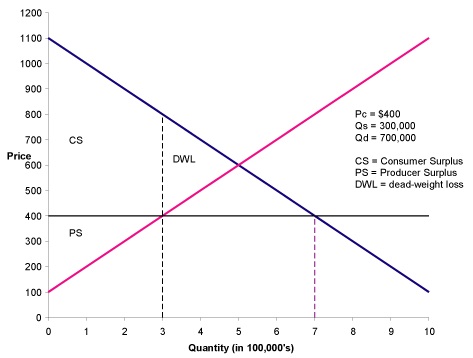
1. Below you have a graph modelling rent control- where the price ceiling for rent is set at $400.

a. Suppose there were no rent control- and so the market is at equilibrium at a price of $600 and a quantity of 5. What's the producer, consumer and total surplus? Show your work for partial credit.
b. Now suppose we enact rent control at $400. Calculate the total shortage amount, the new Producer, Consumer and Total Surplus, and the deadweight loss. Show your work for partial credit.
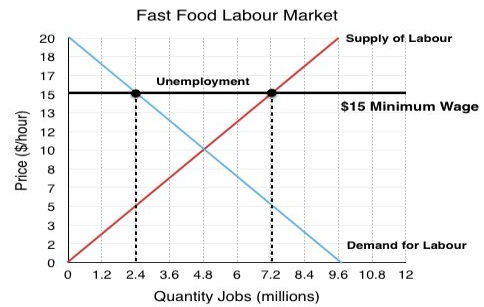
2. Below is a model for the minimum wage. We have Supply of Labor (or Labour) from workers, Demand for Labor from businesses -- and the minimum price of labor (i.e the wage).

a. Suppose there were no minimum wage- and so we are at the standard equilibrium. Find the producer, consumer and total surplus. Show your work for partial credit.
b. Now we enact a minimum wage at $15, represented above. Find the surplus (difference between Quantity Supplied and Quantity Demanded), consumer surplus, producer surplus, total surplus, and deadweight loss. Show your work for partial credit.