Assignment:
1. In a recent presidential election, 611 voters were surveyed and 308 of them said that they voted for the candidate who won (based on the data from the ICR Survey Research Group).
a) Find a 98% confidence interval estimate of the proportion of voters who said that they voted for the candidate who won. Also, interpret the 98% confidence interval.
b) that sample size would be needed for a 95% confidence interval with an error of margin of 0.03?
2. Nielsen Media Research wants to estimate the mean amount of time (in minutes) that full-time college students spending watching television each weekday. Find the sample size necessary to estimate the mean with a 15-minute maximum of error. Assume that a 95% confidence level is desired. Also assume that a pilot study showed that the standard deviation is estimated to be 112.2 minutes.
3. A survey of 30 randomly selected Minnesotans aged 65 and older revealed that, on average, they spent $85 per month on prescription drugs, with a standard deviation of $50.35 per month. Construct a 95% confidence interval for the true mean amount spent per month. Also, interpret the 95% confidence interval.
4. A medical researcher wants to determine whether male pulse rates vary more or less than female pulse rates. Using the sample pulse rates in Data Set 1 in Appendix B, the male pulse rates can be summarized with the statistics n = 40, x¯ = 69.4, s =11.3. For females, the statistics are n = 40, x¯= 76.3, s =12.5. Assume that each sample is a simple random sample obtained from a population with a normal distribution.
a) Construct a 90% confidence interval estimate of the population standard deviation σ of pulse rates for males.
b) Construct a 90% confidence interval estimate of the population standard deviation σ of pulse rates for females.
c) Compare the preceding results. Does it appear that the population standard deviations for males and females are different? Why or why not?
5. It is claimed that about 45% of the customers at a large supermarket do not buy home brand products at all. To put this claim to the test, we go to the supermarket and interview 50 people. Out of the 50, 10 never buy home brand products.
a) What test would you use to test and what are the assumptions we need to make in order to use the test?
b) State clearly the appropriate hypotheses for the test and identify the claim.
c) Calculate the appropriate test-statistic value.
d) Find the p-value.
e) Give your decision and conclusion at a 1 % significance level.
6. A major car manufacturer wants to test a new engine to determine if it meets new air pollution standards. The mean emission of all engines of this type must be more than 20 parts per million of carbon. Ten engines are manufactured for testing purposes and the emission level of each is determined. The data result in an average of 21.93 parts per million with a standard deviation of 2.98.
a) What test would you use and what assumption do we need to make about the distribution of the emission level of this type of engine?
b) Perform this test at 5% level:
7. Use a 5% significance level to test the claim that the heights of female supermodels vary less than the height of women in general. The standard deviation of heights of the population of women is 2.5 in. A random sample of 18 supermodels and found that the mean is 69.9 in and the standard deviation of 1.2 in.
8. The Housing Commission of Washtenaw County is interested in finding out more about the number of rental units that do not meet standard living requirements in both Ypsilanti and Ann Arbor. Units are randomly selected in both cities. Of the 85 units sampled in Ann Arbor, 17 do not meet the requirements. Of the 80 units sampled in Ypsilanti, 24 do not meet the requirements.
a) Is the observed difference in proportions statistically significant? Use α = 0.01.
b) Find a 99% confidence interval for the difference in proportions.
9. If a random sample of 18 homes south of Center Street in Provo has a mean selling price of $145,200 and a standard deviation of $4700, and a random sample of 18 homes north of Center Street has a mean selling price of $148,600 and a standard deviation of $5800, can you conclude that there is significant difference between the selling price of homes in these two areas of Provo at the 0.10 level? Assume the samples were randomly selected from normal populations.
10. In a study to investigate the effect of diet on reducing cholesterol levels, a random sample 15 subjects known to have high cholesterol had their cholesterol measured at the beginning of the study and again after 6 months on a special diet. The results are below. Suppose that you could assume that the differences in cholesterol are a simple random sample from normal population.
d¯ = 8 and sd =16 [ d= before - after]
a) Perform the test if the special diet is effective at reducing cholesterol levels at 5% significance level using P-value method.
b) Find a 90% confidence interval for the mean difference.
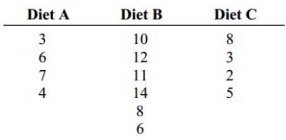
11. A researcher wishes to see whether there is any difference in the weight gains of athletes following one of three special diets. Athletes are randomly assigned to three groups and placed on the diet for six weeks. The weight gains (in pounds) are shown below. At 5% significance level, can the researcher conclude that there is a difference in the diets?

A computer printout for this problem is below.

a) What is the statistical name of the test? Also, list all the requirements for this test.
b) State the hypotheses.
c) Identify the value of the test statistic.
d) Identify the p-value.
e) Give the decision.
f) Conclusion.