GDP Measurement:
Problem 1. The expenditure approach tells us that GDP = Consumption + Investment + Government spending + Net exports
Following is a link of the national income accounts released by the US Bureau of Economic Analysis. Various statistics of GDP are provi ded in around 10 tables. Find the corresponding numbers of nominal GDP, consumption, invest ment, government spending and net exports for 2010. Verify whether the above identity holds true or not.
https://www.bea.gov/newsreleases/na tional/gdp/2011/pdf /gdp4q10_adv.pdf
or you can go to:
https://www.bea.gov/national/index.htm#gdp
and open the link named “PDF version of the Gross Domestic Products release”. Take a look at the tabl es even if they do not contain the information you are required to find. For example, table shows the differences and connections among GDP, GNP, national income and the distribution of national income among various payments.
Problem 2. PengLai is a small island where there are onl y two firms, National Food Company (NFC) and National Clothes Company (NCC). Every year NFC rents land and hires labor from the residents on the island to produce food. If it produces more food than the amount consumed by residents on the island, then this excess supply is exported to other economies. At the same time, NCC borrows money from the island residents to buy cotton cloth from SuHang, a neighboring island. NCC then hires labor to produce clothes using this cotton cloth. Clothes produced in PengLai by NCC are not exported: all clothing produced by NCC stays in PengLai.
Suppose last year NFC produced 1000 tons of food and NCC produces 200,000 articles of clothing. 900 tons of the food and 160,000 articles of clothing were consumed domestically; the rest of the food was exported. The price of food was $1000 per ton and the unit price of clothes was $10 per articles of clothing. NFC paid $300, 000 rent to land owners and $600,000 in wages 2 to labor. NCC borrowed $1,000,000 to buy cotton cloth while it paid $50,000 in interest for this loan and $850,000 in wages to labor.
What is the value of GDP in PengLai last year based on the given information? Calculate GDP using the expenditure approach, the income appro ach and the value added approach. Do all three approaches provide the same measure of GDP? (If they don’t give the same number you have made an error: go back and review your work and fix the error.)
Real vs. Nominal:
Problem 3. In the following table is data showing US GDP and inflation for the past ten years. Nominal and real GDP series are taken from the website of the US Bureau of Economic Analysis ( https://www.bea.gov/national/index.htm#gdp ), while the last column is calculated from CPI data provided at the website of the US Bureau of Labor Statistics (https://data.bls.gov/cgi- bin/surveymost?bls , CPI for All Urban Consumers (CPI-U) 1982-84=100 (Unadjusted) - CUUR0000SA0). You are encouraged to use excel or other software to do the following calculations.
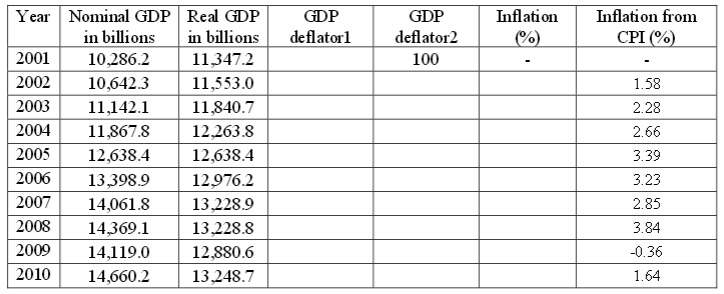
(1) According to the table above, which year is used as the base year in calculating real GDP? Why?
(2) Using the formula for the GDP deflator given in class, calculate the GDP deflator for the last ten years and fill out the column labeled GDP deflator1.
(3) Now we want to redefine the base year and make the year 2001 the new base year. When we do this the GDP deflator in 2001 will have a value of 100 on a 100 point scale. Use your answer s from part (2), GDP deflator 1, to fill out the column labeled as GDP deflator 2.
(4) Define inflation as the % change in the ge neral price level; review your class notes for the general formula for the % change in the general pr ice level. Calculate the annual inflation rate for the last ten years based upon the GDP deflator and fill out the column labeled inflation. Compare your calculation of the inflation rate using the GDP deflator to the measure of inflation provided by the CPI (see the column labeled “inflation from CPI”). Are these two measures of inflation equal? Why or why not?
CPI:
Problem 4. Suppose the only consumption of residents on the planet Fruits are apples, bananas and cherries. On average, a person consumes 6 apples, 9 bananas and 3 cherries every day. These numbers are thus defined as the market basket. The prices of these fruits in the past three years are given below: assume all prices are measured in dollars.
Year 2008 Year 2009 Year 2010
Price of an apple 2 1 3
Price of a banana 1 2 2
Price of a cherry 3 4 5
(1) From the above information calculate the CPI using 2008 as the base year. Then, recalculate the CPI with 2009 and then 2010 as the base y ear. In each case, use a 100 point scale for the CPI (that is, the CPI for the base year should ha ve a value of 100). Put your CPI values in the chart below.
2008 as base year 2008 as base year 2008 as base year
CPI of 2008 2 1 3
CPI of 2009 1 2 2
CPI of 2010 3 4 5
(2) Using the CPI values you calculated in part (1 ), find the rate of inflation in 2009 and 2010. Put your answers in the table below. Do you get the same rate of inflation for each year irrespective of the base year chosen? Explain your answer.
2008 as base year% 2008 as base year% 2008 as base year%
Inflation: 2008-2009
Inflation: 2009-2010
(3) As a resident of the planet Fruits, Joey’s nominal income in the year 2008 is $10,000, what must be his nominal income in the year 2010 in order for Joey to avoid a decrease in his real income between 2008 and 2010? Use 2008 as the base year in this question.
(4) Chandler, Joey’s roomie, earns a real income of $10,000 in the year 2009, where real income is calculated using 2009 as the base year. What mu st be his nominal income in the year 2010 in order for Chandler to avoid a decrease in his real income between 2009 and 2010?
Unemployment Measurement:
Problem 5. The table below provides data on Wisconsin employment taken from US Bureau of Labor Statistics .
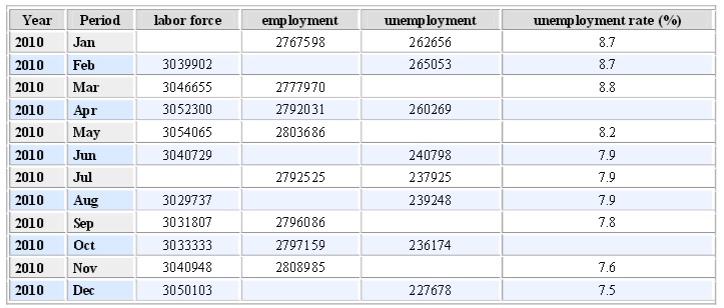
(1) Fill out the missing numbers in the table
(2) According to the US Census Bureau, Wisconsin has a population of about 5.6 million people. Why is the labor force in the above table only about 3 million people? Which groups of people are not included in the labor force? List at least four groups. Suppose that the Kingdom of Workers (KOW) is a country which has exactly the same amount of labor force, employed and unemployed workers as Wisconsin in December 2010. Among those 227678 unemployed workers in the KOW, 60000 of them are temporarily laid-off workers and newly graduated students who expect to find a new job soon, while 50000 of them are searching for jobs in the market where there are fe w vacancies due to the type of job.
(3) Given this information, what is the struct ural unemployment rate in KOW? What is the frictional unemployment rate in KOW? What is the cyclical unemployment rate in KOW? What is the natural unemployment rate in KOW?