Assignment:
Q1. What are the expected number of yearly breakdowns for the power generator at Orlando Utilities that has exhibited the following data over the past 20 years?
|
Number of breakdowns
|
0
|
1
|
2
|
3
|
4
|
5
|
6
|
|
Number of years in which breakdown occurred
|
2
|
2
|
5
|
4
|
5
|
2
|
0
|
Q2. Each breakdown of a graphic plotter table at Airbus Industries costs $50. Find the expected daily breakdown cost, given the following data:
|
Number of breakdowns
|
0
|
1
|
2
|
3
|
4
|
|
Daily breakdown potability
|
.1
|
.2
|
.4
|
.2
|
.1
|
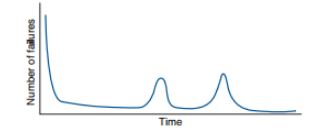
Q3. David Hall, chief of the maintenance department at Mechanical Dynamics, has presented you with the following failure curve. What does it suggest?
Provide complete and step by step solution for the question and show calculations and use formulas.