1. Below is select sales data for RX Industries. The orders range from 1 to 20, however any returned or canceled orders have been deleted from the data. Use the template below to create an order summary that automatically shows the data for any selected order ID between 1 and 20. Hint: Use the IFERROR and HLOOKUP functions. The function for any order ID in the range that has been deleted should return the phrase "Not Found."
| OrderID |
1 |
7 |
9 |
13 |
16 |
2 |
3 |
| Region |
East |
East |
East |
East |
East |
West |
West |
| OrderDate |
1/10/2009 |
3/6/2009 |
3/28/2009 |
4/8/2009 |
4/12/2009 |
5/16/2009 |
5/23/2009 |
| OrderAmt |
$1,122.00 |
$ 4,453.00 |
$ 1,305.00 |
$2,708.00 |
$1,502.00 |
$4,796.00 |
$1,526.00 |
| 5 |
10 |
14 |
4 |
8 |
11 |
17 |
18 |
| West |
West |
West |
Central |
Central |
Central |
Central |
Central |
| 6/2/2009 |
7/8/2009 |
7/30/2009 |
8/29/2009 |
9/9/2009 |
10/5/2009 |
11/16/2009 |
12/25/2009 |
| $1,523.00 |
$2,068.00 |
$1,597.00 |
$ 781.00 |
$2,976.00 |
$4,145.00 |
$3,979.00 |
$2,044.00 |
2.
1)Change the Income Amount in Cell B3.
2) Watch the amounts change in cells C4 and H4.
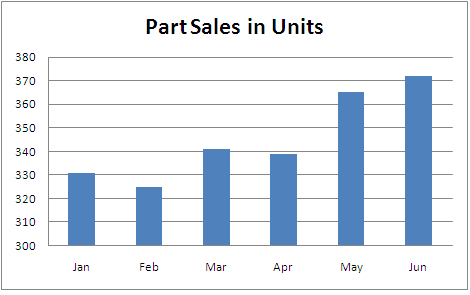
3) Look at the formulas in C4 and H4. They use the lookup function to compare the part number in B3 to the numbers in C6:F6, and "scan" the array table values in C7:F12 to find the sales in units for each month. The number at the end of the formula indicates the row of the array table from which the value should be pulled. In HLOOKUP, the row of heading labels (i.e. part #s)counts as the first row.
| FIN 615 HLOOKUP Example |
|
|
|
|
|
|
|
|
Unit Sales |
|
|
|
|
| Part #: |
D20B3 |
Jan |
Feb |
Mar |
Apr |
May |
Jun |
|
|
331 |
325 |
341 |
339 |
365 |
372 |
|
|
|
|
|
|
|
|
| Part # |
|
D20B2 |
D20B3 |
D20B4 |
D20B5 |
|
|
| January |
|
123 |
331 |
285 |
475 |
|
|
| February |
|
128 |
325 |
287 |
525 |
|
|
| March |
|
126 |
341 |
266 |
577 |
|
|
| April |
|
124 |
339 |
275 |
584 |
|
|
| May |
|
130 |
365 |
289 |
596 |
|
|
| June |
|
133 |
372 |
295 |
634 |
|
|

3. Pivot Table Problem
Below is the December 2009 sales data bysales representative for Papier Nouveau, a distributor of commercial printing supplies. As the Director of HR for Papier Nouveau, you are responsible for calculating monthly incentives. In previous months, bonuses were based on sales volume, however this month you are considering basing them on profit margin. Create pivot tables to help you answer the following questions in analyzing the December sales:
a) What is the highest volume of our highest margin product sold in December?
b) What is the average total profit generated for the month?
c) What is the total number of commercial copiers sold during December?
| Employee ID |
Region |
Product |
Profit Margin per Unit |
Volume Sold |
| 11048 |
SW |
Cartridges |
$ 7.00 |
200 |
| 11048 |
SW |
Paper (ream) |
$ 25.00 |
1,900 |
| 11048 |
SW |
Printers |
$ 103.00 |
7 |
| 12345 |
NE |
Commercial Copiers |
$ 593.00 |
4 |
| 12345 |
NE |
Paper (ream) |
$ 25.00 |
2,000 |
| 12345 |
NE |
Printers |
$ 103.00 |
8 |
| 26427 |
MW |
Cartridges |
$ 7.00 |
600 |
| 26427 |
MW |
Paper (ream) |
$ 25.00 |
7,300 |
| 26427 |
MW |
Printers |
$ 103.00 |
4 |
| 62380 |
NW |
Fax Machine |
$ 121.00 |
7 |
| 62380 |
NW |
Laminating Machine |
$ 375.00 |
3 |
| 62380 |
NW |
Printers |
$ 103.00 |
21 |
| 67890 |
SW |
Cartridges |
$ 7.00 |
820 |
| 67890 |
SW |
Commercial Copiers |
$ 593.00 |
6 |
| 67890 |
SW |
Paper (ream) |
$ 25.00 |
980 |
| 73628 |
NW |
Commercial Copiers |
$ 593.00 |
7 |
| 73628 |
NW |
Fax Machine |
$ 121.00 |
8 |
| 73628 |
NW |
Paper (ream) |
$ 25.00 |
4,900 |
| 82745 |
SE |
Cartridges |
$ 7.00 |
500 |
| 82745 |
SE |
Commercial Copiers |
$ 593.00 |
2 |
| 82745 |
SE |
Paper (ream) |
$ 25.00 |
750 |
| 92857 |
NE |
Laminating Machine |
$ 375.00 |
5 |
| 92857 |
NE |
Paper (ream) |
$ 25.00 |
200 |
| 92857 |
NE |
Printers |
$ 103.00 |
11 |
| 95202 |
SE |
Fax Machine |
$ 121.00 |
2 |
| 95202 |
SE |
Paper (ream) |
$ 25.00 |
5,000 |
| 95202 |
SE |
Printers |
$ 103.00 |
9 |