1) A large city is in the process of voting on a bond issue to build a covered sports arena. A local political analyst wishes to determine if the level of income will impact on the decision of the voters. He takes a sample of 350 who plan to vote in the upcoming election.
Vote on Bond Issue
Income Yes No Total
Under $20,000 8 12 20
$20,000 — under $30,000 26 20 46
$30,000 — under $40,000 102 50 152
$40,000 — under $50,000 50 58 108
$50,000 or above 14 10 24
Total 200 150 350
a) What is the appropriate table value for a test for independence at the 0.025 significance level?
b) What is the expected frequency of the $50,000 and over and No categories?
c) What is the calculated value of the test statistic?
2) The owner of a video store is interested in whether or not there is a difference in the proportions of VCR movies rented by members and non-members among movie titles. Three movies are selected and each person who rents them is identified as a member or non-member. A total of 350 people rent these movies and the responses are:
Movie
Membership Witness Rambo Karate Kid Total
Member 21 14 70 105
Non-Member 79 86 80 245
'Total 100 100 150 350
What are the degrees of freedom for the test of equal proportions?
What is the expected frequency of the cell Rambo and Non-member?
What is the computed value of the test statistic?
What is the critical value for a 0.01 significance level?
3) The following table shows the selling price and mileage of 7 used cars of a certain model.
mileage Price
22,600 $15,200
32,100 $12,500
43,800 $13,900
51,800 $9500
59,400 $11,600
65,500 $11,700
74,700 $8900
Identify the dependent and independent variable.
Find the least-squares regression line.
Using the least-squares regression line, predict the selling price of a car with 55,000 miles.
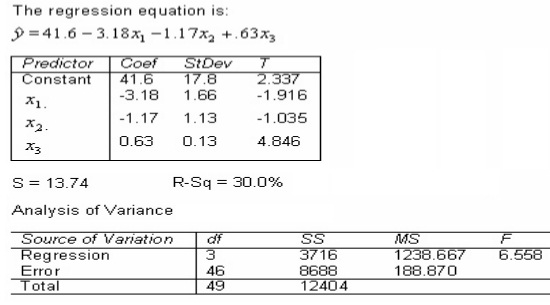
4) A statistics professor investigated some of the factors that affect an individual student's final grade in his course. He proposed the multiple regression model where:
y = final mark (out of 100)
x1 = number of lectures skipped
x2 = number of late assignments
x3 = mid-term test mark (out of 100)
The professor recorded the data for 50 randomly selected students. The computer output is shown below.

Do these data provide enough evidence to conclude at the 5% significance level that the model is useful in predicting the final mark?
Test statistic = ____________________
Critical Value = ____________________
Conclusion: ____________________
Do these data provide enough evidence to conclude at the 5% significance level that the final mark and the number of skipped lectures are linearly related?
Test statistic = ____________________
Critical Value = ____________________
Conclusion: ____________________
Do these data provide enough evidence at the 5% significance level to conclude that the final mark and the number of late assignments are negatively linearly related?
Test statistic = ____________________
Critical Value = ____________________
Conclusion: ____________________
Do these data provide enough evidence at the 1% significance level to conclude that the final mark and the mid-term mark are positively linearly related?
Test statistic = ____________________
Critical Value = ____________________
Conclusion: ____________________
What is the coefficient of determination? What does this statistic tell you?
Interpret the coefficients b1 and b3.
b1 = ____________________
Interpretation: ____________
b3 = ____________________
Interpretation: __________