Problem 1. Line A and Line B are both straight lines. The points (30, 10) and (0, 15) lie on Line A. The points (5,10) and (15, 40) lie on Line B.
a. Draw Line A and Line B on a graph.
b. Write the equations of line A and Line B in slope-intercept form.
c. What is the point of intersection between Line A and Line B? (Hint: carry your answer out to two places past the decimal.)
Problem 2. Are the following statements positive or normative statements?
a. If the government lowers taxes, then people will be better off.
b. Milwaukee is the capital of Wisconsin.
c. If the government lowers taxes, then consumer spending will increase.
d. Hillary Clinton is the best candidate for President of the United States.
Problem 3. Jack and Jill both produce only shirts and wheat. In one week, Jack can produce either 10 shirts and 0 units of wheat or 10 units of wheat and 0 shirts, or any other combination lying on the line between those two points. In one week, Jill can produce either 6 shirts and 0 units of wheat or 3 units of wheat and 0 shirts, or any other combination lying on the line between those two points.
a. Who has the absolute advantage in the production of wheat?
b. Who has the absolute advantage in the production of shirts?
c. What is the opportunity cost (in terms of shirts) for Jack for the production of one unit of wheat? What about for Jill?
d. What is the opportunity cost (in terms of units of wheat) for Jack for the production of one shirt? What about for Jill?
e. Suppose Jack and Jill decide to specialize and trade with each other. Who should buy and sell each good?
f. If they were to trade with each other, what is a price (in terms of units of wheat) for a shirt for which they would both agree to the trade?
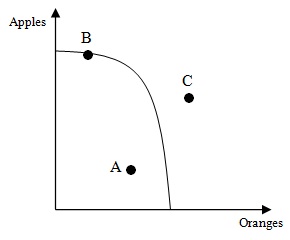
Problem 4. A country only produces 2 goods: apples and oranges. The following graph shows their production possibilities frontier:

a. Is point A feasible? Is it efficient?
b. Is point B feasible? Is it efficient?
c. Is point C feasible? Is it efficient?
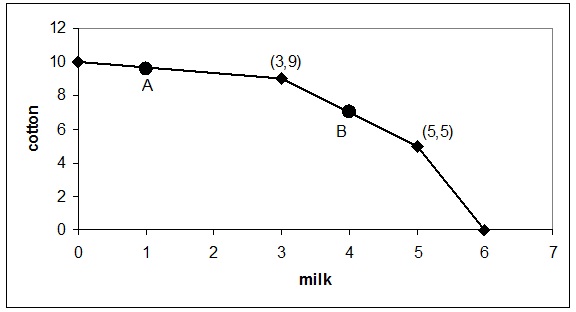
Problem 5. A country produces 2 goods: milk and cotton. The following graph shows their production possibilities frontier. Four points are shown in the figure: the points (0,10), (3,9), (5,5), and (6,0). The PPF is linear on the line segments between each of these 4 points.

a. What is the opportunity cost (in terms of units of cotton) of producing another unit of milk at point A?
b. What is the opportunity cost (in terms of units of milk) of producing another unit of cotton at point B?