1) 2 + 2 = 5 is
A) a normative statement.
B) a moral judgment.
C) correct, given common assumptions.
D) a positive statement.
2) An increase in consumer incomes will lead to
A) a rightward shift of the demand curve for plasma TVs.
B) a movement upward along the demand curve for plasma TVs.
C) a rightward shift of the supply curve for plasma TVs.
D) no change of the demand curve for plasma TVs.
3) As the price of a good increases, the change in the quantity demanded can be shown by
A) shifting the demand curve leftward.
B) shifting the demand curve rightward.
C) moving down along the same demand curve.
D) moving up along the same demand curve.
4) If the price of automobiles were to increase substantially, the demand curve for gasoline would most likely
A) shift leftward.
B) shift rightward.
C) remain unchanged.
D) become steeper.
5) An increase in the demand curve for orange juice would be illustrated as a
A) leftward shift of the demand curve.
B) rightward shift of the demand curve.
C) movement up along the demand curve.
D) movement down along the demand curve.

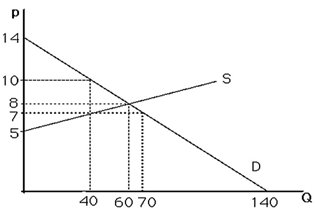
6) The above figure shows a graph of the market for pizzas in a large town. No pizzas will be demanded unless price is less than
A) $0.
B) $5.
C) $12.
D) $14.
7) The above figure shows a graph of the market for pizzas in a large town. If the price falls from $10 to $7 per pizza, the quantity of pizzas demanded will
A) increase by 20.
B) decrease by 30.
C) increase by 30.
D) decrease by 10.
8) Assume the price of a movie is $10. Jenna demands 2 movies per week, Sam demands 3 movies per week, and Jordan demands 8 movies per week. From this information we can conclude that
A) the market quantity demanded at a price of $10 is at least 13 movies per week.
B) Jordan is obviously more wealthy than either Sam or Jeanna.
C) Sam is irrational compared to Jenna or Jordan.
D) the movie industry is unprofitable.
9) Suppose the demand curve for a good shifts rightward, causing the equilibrium price to increase. This increase in the price of the good results in
A) a rightward shift of the supply curve.
B) an increase in quantity supplied.
C) a leftward shift of the supply curve.
D) a downward movement along the supply curve.
10) The above figure shows a graph of the market for pizzas in a large town. At a price of $14, there will be
A) no pizzas supplied.
B) equilibrium.
C) excess supply.
D) excess demand.
11) The above figure shows a graph of the market for pizzas in a large town. At a price of $5, there will be
A) excess demand.
B) excess supply.
C) equilibrium.
D) zero demand.
12) The above figure shows a graph of the market for pizzas in a large town. What are the equilibrium price and quantity?
A) p = 8, Q = 60
B) p = 7, Q = 40
C) p = 7, Q = 70
D) p = 10, Q = 40