--%>

Wealth distribution by income

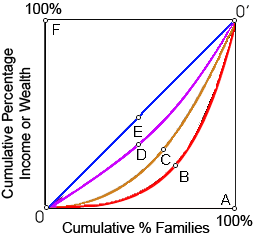
When line 0C0' shows the 2005 U.S. income distribution, in that case the line that would shows the 2005 wealth distribution would be probably line: (1) line 0A0'. (2) line 0B0'. (3) line 0C0'. (4) line 0D0'. (5) line 0E0'.

165_Problem on Lorenz Curve1.png

I need a good answer on the topic of Economics problems. Please give me your suggestion for the same by using above options.

   Related Questions in Microeconomics

  • Q : Free Trade Agreement Tell me the answer

    Tell me the answer of this question. Critics of the North American Free Trade Agreement (NAFTA) falsely feared that it would: A) increase the flow of illegal Mexican immigrants to the United States. B) cause the European Union and Japan to raise trade barriers against

  • Q : Increasing elasticity of the demand for

    The elasticity of the demand for labor tends to rise as there are raises within the: (1) amount of capital utilized in a production process. (2) rate of automation in an industry. (3) difficulty in substituting between different resources. (4) share o

  • Q : Oligopoly and Economic Welfare Assume

    Assume that P = MSB and the firms in an oligopoly are in equilibrium where P>MC. This follows that: (1) P=MSC. (2) MSB>MSC. (3) MSB<MSC. (4) oligopolists will gain zero economic profit. (5) the minimum point on the LRATC curve will achieved i

  • Q : A legal price floor and revenues Assume

    Assume that the U.S. wheat market is firstly into equilibrium on S0D0. Now assume the government institutes a legal price floor at P3 per bushel of wheat. When the government does nothing else, one outcome will be such

  • Q : Equilibrium price in the short run The

    The equilibrium price for Christmas trees in the short run is: (w) P1. (x) P2. (y) P3. (z) P4.

    Q : Determine relatively price elasticity

    A price elasticity of demand of 2.0 implies that at that point, the demand curve is: (w) income elastic. (x) relatively price elastic. (y) relatively price inelastic. (z) unitarily price elastic. I need a good answ

  • Q : Average retail price and the consumer

    Table illustrates the average retail price of milk and the Consumer Price Index from the year 1980 to 1998.

    Q : Why production possibilities curve

    What is the reason that production possibilities curve concave? Elucidate.

  • Q : Demand of a competitive firm The

    The competitive firm will demand more labor when: (i) Technological advances support automation. (ii) The price of firm's output increases. (iii) More firms enter in the industry. (iv) The value of marginal product is beneath the wage rate. (v) Worker

  • Q : Market Power-Monopsony Power- Output

    Assume that a firm with market power in the output market wants to develop and that hiring more workers needs it to raise salaries 8 percent for all the workers. Output prices will most likely: (w) Increase 8 percent to cover the wage rise. (x) Increase less than 8 pe