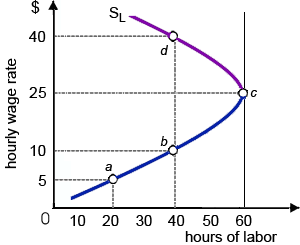
Wage rate and labor in supplying
By the following choices in this illustrated graph, this worker would be happiest at point: (w) point a. (x) point b. (y) point c. (z) point d. Please choose the right answer from above...I want your suggestion for the same.
By the following choices in this illustrated graph, this worker would be happiest at point: (w) point a. (x) point b. (y) point c. (z) point d.
Please choose the right answer from above...I want your suggestion for the same.
Explain the Economies of Scale.
A firm which is a price taker in the labor market will hire labor to the point where the wage rate is equals labor’s: (w) average output. (x) marginal revenue product. (y) average revenue product. (z) marginal physical product.<
An equilibrium point on the resource demand curve of a competitive firm operating within a competitive labor market would indicate equality among the resource price and: (w) demand elasticity. (x) quantity demanded. (y) VMP of the resource. (z) output
An increase within competitively-set wages tends to cause firms to adjust hence there are reductions into the: (1) amounts of labor most firms hire. (2) value of the marginal productivity of workers. (3) marginal profit from hiring labor. (4) technolo
The firm in this illustrated graph is clearly: (1) price taker in the sale of its output because of the shapes of the VMP and MRP curves. (2) price taker in the purchase of labor when this can hire as several workers as this chooses at roughly of $13 per hour. (3) mon
Screening and signaling are attempts to: (w) decreases job interview time. (x) decrease the problem of adverse selection. (y) uphold equal opportunity laws. (z) All of the above. I need a good answer on the topic o
Define the pricing of a new product.
Define the difference between accounting and economic cost.
States the functions and responsibilities of managerial economist?
demand function is: QY = -8,000 - 5,000PY + 192A + 120I + 2,000PX (6,000) (1,000) (120) (80) (800) R2 = 91% Here QY is quantity (measured in units) of Product Y demanded in the current period, A is hundreds of dollars of advertising ($00), I is thousands of dollars of disposable income per ca
18,76,764
1927528 Asked
3,689
Active Tutors
1430596
Questions Answered
Start Excelling in your courses, Ask an Expert and get answers for your homework and assignments!!