--%>

Variation in supply and demand curves cause rental price

These supply and demand curves for housing do NOT involve that the: (w) demand for housing has increased. (x) supply has increased, because rental price has risen. (y) equilibrium price and quantity of housing have increased. (z) housing market will clear at price R1.
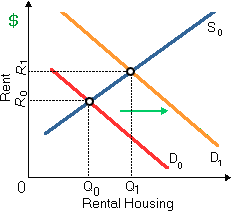
1836_supply and demand curves for housing.png

How can I solve my economics problem? Please suggest me the correct answer.

   Related Questions in Microeconomics

  • Q : Problem on Market clearing price The

    The Equilibrium in a market needs the attainment of a: (1) Balancing act passed by the Congress. (2) Supply price for each and every possible quantity. (3) Demand quantity for each and every possible price. (4) Market clearing price.

    Q : Demonstrate supply curve for price

    The quantity supplied is ever more sensitive as output increases, therefore the price elasticity of supply raises as the price raises for the supply curve demonstrated in: (w) Panel A. (x) Panel B. (y) Panel C. (z) Panel D.

  • Q : Reduction in demand of Complementary

    Mold that damaged the hamburger crop following a flood would be most probable to decrease the demands for: (i) fried chicken with gravy and mashed potatoes. (ii) Soda pop and bottled water. (iii) Carrots, cucumbers and egg plant. (iv) Ketchup and mustard. (v) Sushi an

  • Q : Influence output price by market power

    Every firm which can considerably influence the price of its output: (i) is a pure monopoly. (ii) will be more profitable than any firm in pure competition. (iii) has market power: (iv) is essentially large relative to the market demand curve facing the firm. (v) has

  • Q : Elasticity formula when price falls

    When the quantity of SCUBA lessons demanded by Hawaiian tourist’s increases from 800 to 1,000 weekly and if the price drops/falls from $30 to $20 per session, by using the arc elasticity formula, the price elasticity of demand will be: (i) 5.555

  • Q : Average variable cost curve of firm Can

    Can someone specify correct answer of the given query of demonstrated figure in below that curve J is that cranberry of: (w) industry’s supply curve. (x) firm’s demand curve. (y) firm’s average variable cost curve. (z) firm’s short-run supply c

  • Q : Define Marginal rate of transformation

    Marginal rate of transformation: This is the amount of one good which should be given to generate one additional unit of a second good. This is also termed as marginal opportunity cost.

  • Q : Problem on positive quantity Supply The

    The law of supply defines that, other things equivalent: (1) Quantity supplied differs inversely with price. (2) A good’s supply is positively associated to its demand. (3) Quantity supplied is positively associated to price. (4) Prices and cost

  • Q : Negatively-sloped-Law of Demand The

    The Demand curves are negatively-sloped mainly as people: (1) Encounter advertising which molds the product images. (2) Have less purchasing power if prices fall for the things they sell. (3) Use goods which rise in price less, and expand the utilizat

  • Q : Why are buyers and sellers forced to be

    Several buyers and sellers are forced to be price-takers since: (w) vigorous competition maintains individuals from noticeably influencing the market. (x) only monopoly firms adjust quantities. (y) markets adjust slowly. (z) quantity adjustment is not