--%>

Use the NW corner rule to find an initial BFS


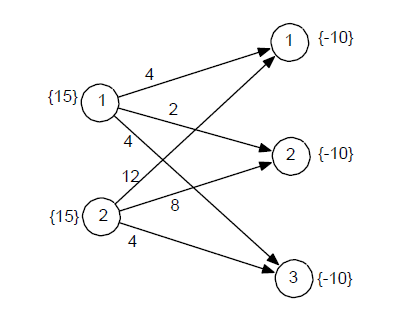
(a) Use the NW corner rule to find an initial BFS, then solve using the transportation simplex method. Indicate your optimal objective function value.

(b) Suppose we increase s1 from 15 to 16, and d3 from 10 to 11. Show that even though an extra unit is being shipped, the total shipping cost actually decreases by $2. Explain why increasing both supply and demand has resulted in a decreased solution cost by relating this phenomenon to the dual variables associated with supply node 1 and demand node


1825_Transportation_Problem.png

   Related Questions in Basic Statistics

  • Q : Correlation analysis and the regression

    1).  When you take out a mortgage, there are many different kinds of costs.  Usually the two largest are the interest rate (annual percentage that determines the size of your monthly payment) and the loan fee (a one-time percentage charged to you at the time

  • Q : Problems on ANOVA We are going to

    We are going to simulate an experiment where we are trying to see whether any of the four automated systems (labeled A, B, C, and D) that we use to produce our root beer result in a different specific gravity than any of the other systems. For this example, we would l

  • Q : Explain Service times Service times: A)

    Service times:A) In most cases, servicing a request takes a “short” time, but in a few occasions requests take much longer.B) The probability of completing a service request by time t, is independent of how much tim

  • Q : Define Utilization Law Utilization Law

    Utilization Law: • ρk = XK . SK = X . DK • Utilization of a resource is the fraction

  • Q : Statics for each of the following

    for each of the following studies a and b decide whether to reject the null hypothesis that groiups come from identical populations. Use the .01 level. (c) Figure the effects size for each study. (d) ADVANCED TOPIC: Carry out an analysis of variance for study (a) using the strucurtal method.

  • Q : Problem on queuing diagram Draw a 

    Draw a queuing diagram for the systems below and describe them using Kendall’s notation: A) Single CPU system <

  • Q : Define Service Demand Law

    Service Demand Law:• Dk = SKVK, Average time spent by a typical request obtaining service from resource k• DK = (ρk/X

  • Q : Calculate the p- value Medical tests

    Medical tests were conducted to learn about drug-resistant tuberculosis. Of 284 cases tested in New Jersey, 18 were found to be drug- resistant. Of 536 cases tested in Texas, 10 were found to be drugresistant. Do these data indicate that New Jersey has a statisti

  • Q : STATISTICS Question This week you will

    This week you will analyze if women drink more sodas than men.  For the purposes of this Question, assume that in the past there has been no difference.  However, you have seen lots of women drinking sodas the past few months.  You will perform a hypothesis test to determine if women now drink more

  • Q : Principles of data analysis For the

    For the data analysis project, you will address some questions that interest you with the statistical methodology we are learning in class. You choose the questions; you decide how to collect data; you do the analyses. The questions can address almost any topic,